
Cost to Serve
Find out what it really costs to serve every customer, product, and order.
Trusted by Growing Companies at Every Stage of Network Design Maturity









Why can’t most teams see it clearly?
Companies often know a product’s blended margin. Almost none can say, with confidence, which customers or products actually erode it.

Lack of granular cost and margin insight
Finance may know a product’s overall margin, but without end-to-end supply chain cost allocation, it’s hard to pinpoint which customers or products are eroding it.

Siloed systems and data
Most companies rely on fragmented systems that don’t connect supply chain activity to cost, making actionable insight nearly impossible.

Inefficient fixed cost utilization
Fixed costs, like asset investments, are major cost drivers, but optimizing their use requires a much deeper understanding of cost-to-serve dynamics.
A cost to serve model built for real supply chains
Every cost element gets traced and allocated to the supply source, product, and customer that actually caused it, so a cost to serve analysis reflects reality instead of an average.

End-to-end cost-to-serve modeling
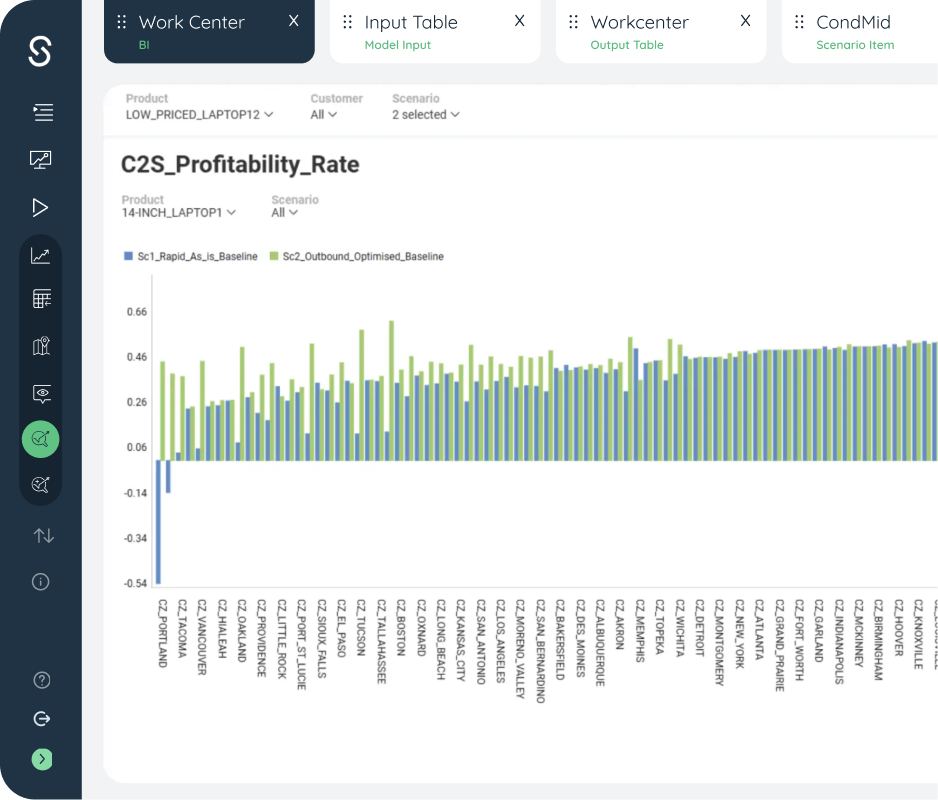
Automatically assign every cost element across the supply chain, from suppliers, plants, and distribution centers to customers, for a complete view of cost per customer.

Detailed BOM and time/location tracking
Capture true cost and margin using a detailed bill of materials plus real transaction time and location data, down to the SKU and order.

Fixed cost allocation
Break fixed costs into variable components per product path, enabling more precise allocation and optimization.
Not every ‘cost to serve’ number is one you can trust
What to look for
How Sophus delivers it
Granularity
Automation
Fixed cost treatment
Connected to decisions
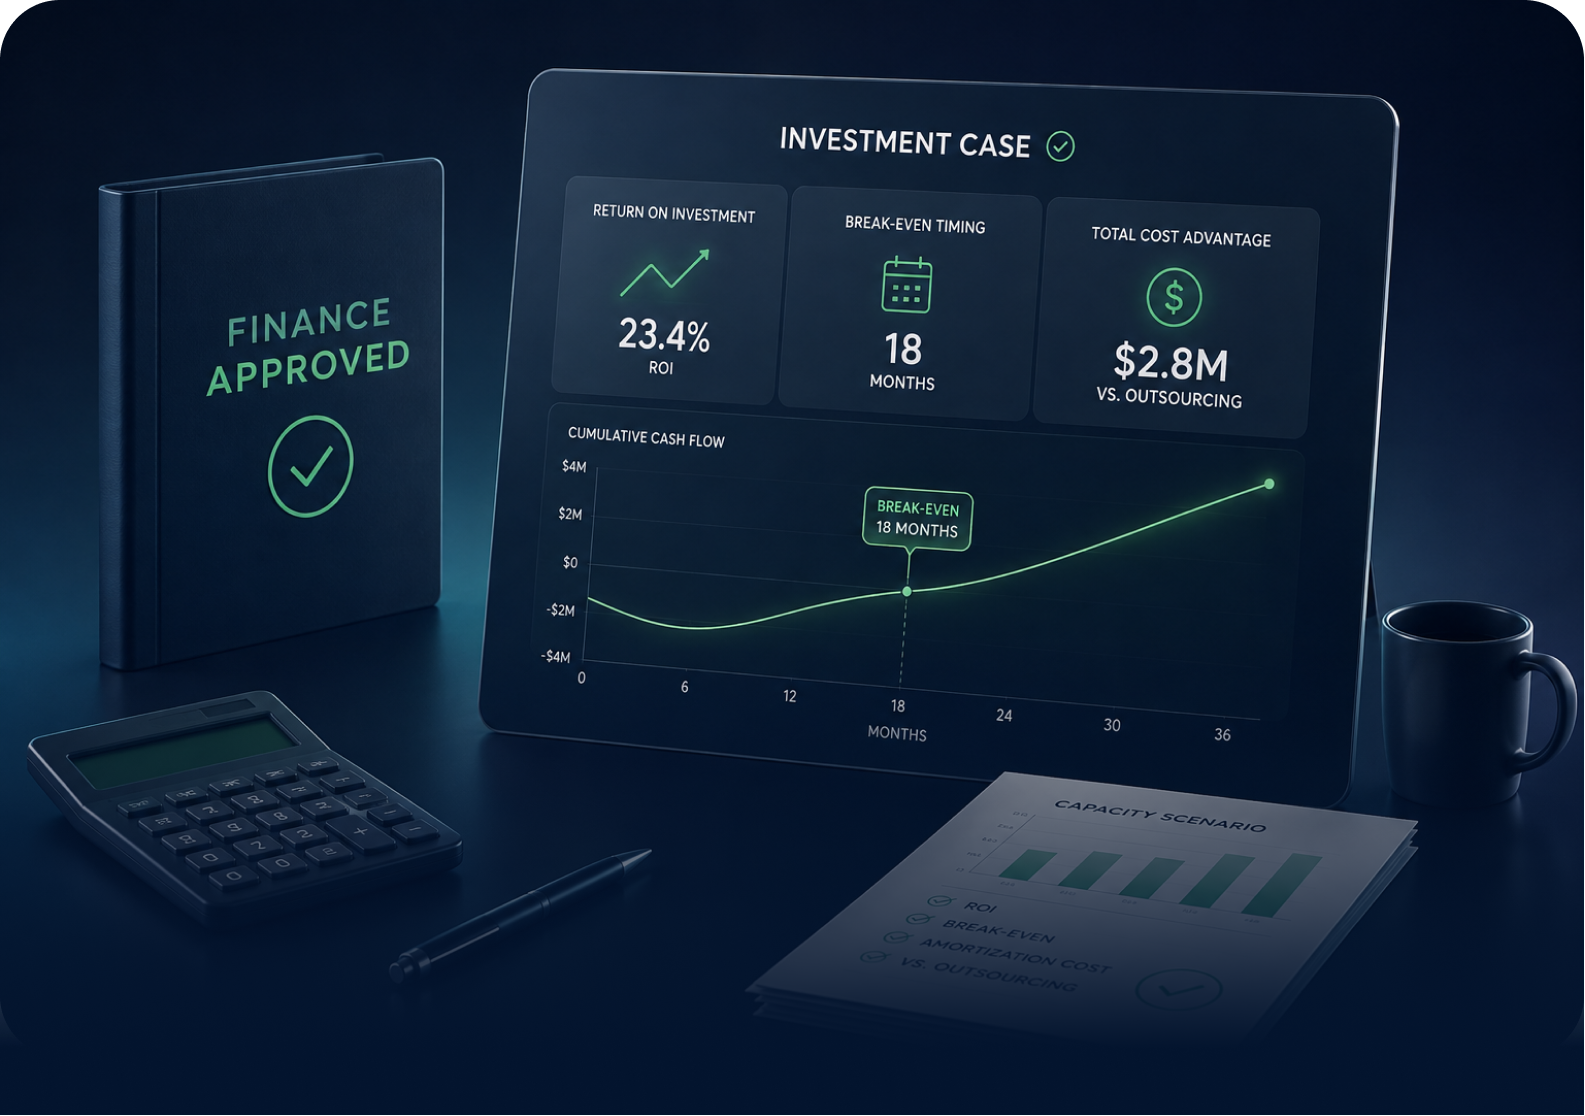
What a real cost to serve view changes
10–15%
Cost reduction
Improved profitability per customer
Granular cost-to-serve insights enable tailored service tiers and pricing strategies that sharpen profitability.
Data-driven decision-making
Continuous insight supports strategic supply chain decisions, protecting long-term efficiency and competitiveness.
What’s actually running behind the numbers
Cost-to-serve modeling like this doesn’t happen in a spreadsheet. It runs on two purpose-built platforms working together.
Network Design Platform
Sophus X: Every what-if, answered before you commit
Sophus X is an AI-native supply chain network design platform. It maps your entire network, balances inventory, plans production, and tests what-if scenarios before they cost you anything.

Built with advanced mathematical algorithms and quantum solver capability, running complex optimization models 10–100x faster than legacy platforms.

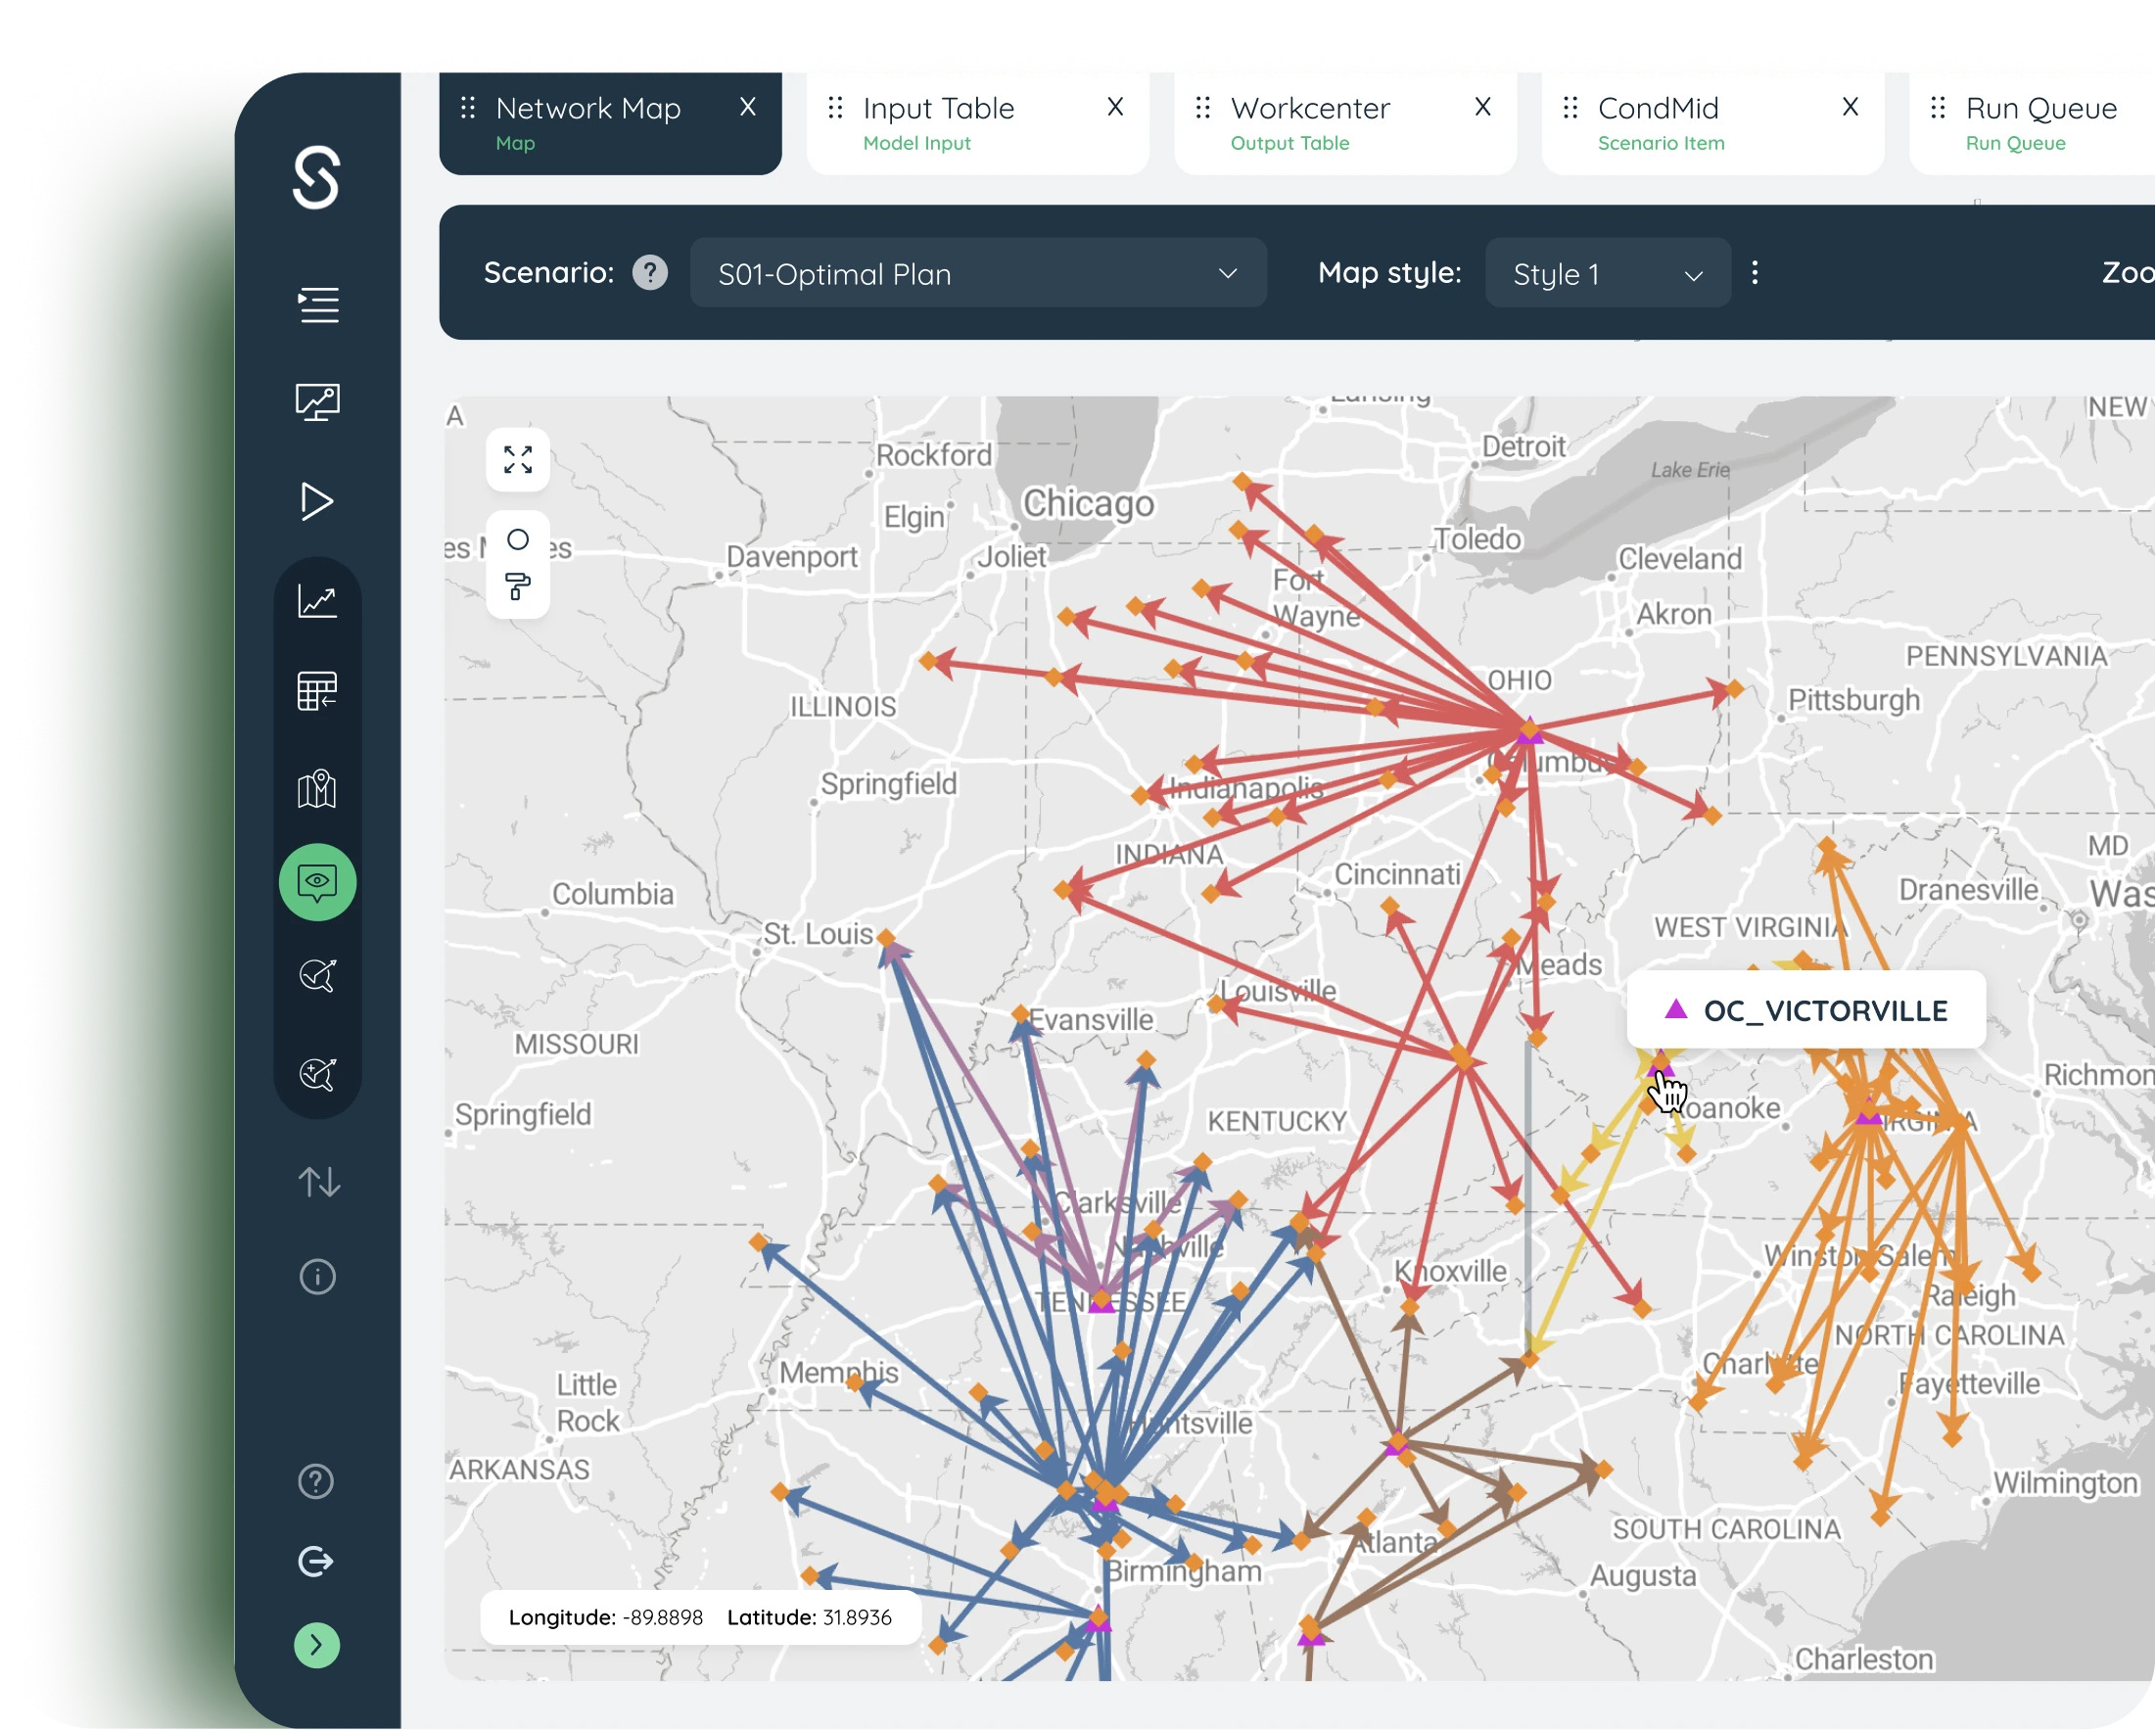
Visualize network dynamics, evaluate costs like freight and site operations, and model facility closures or disruptions before they happen.
Deep visibility into cost flow across multiple echelons and bills of materials, the foundation that powers everything on this page.
Data Automation Layer
Dastro: Skip the data wrangling entirely
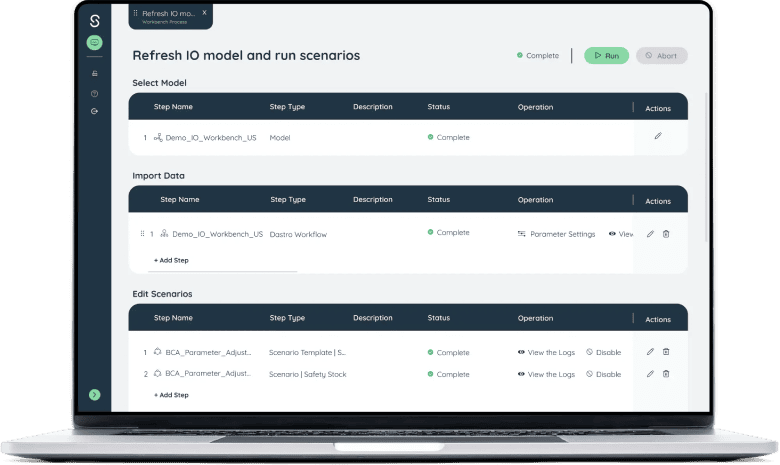
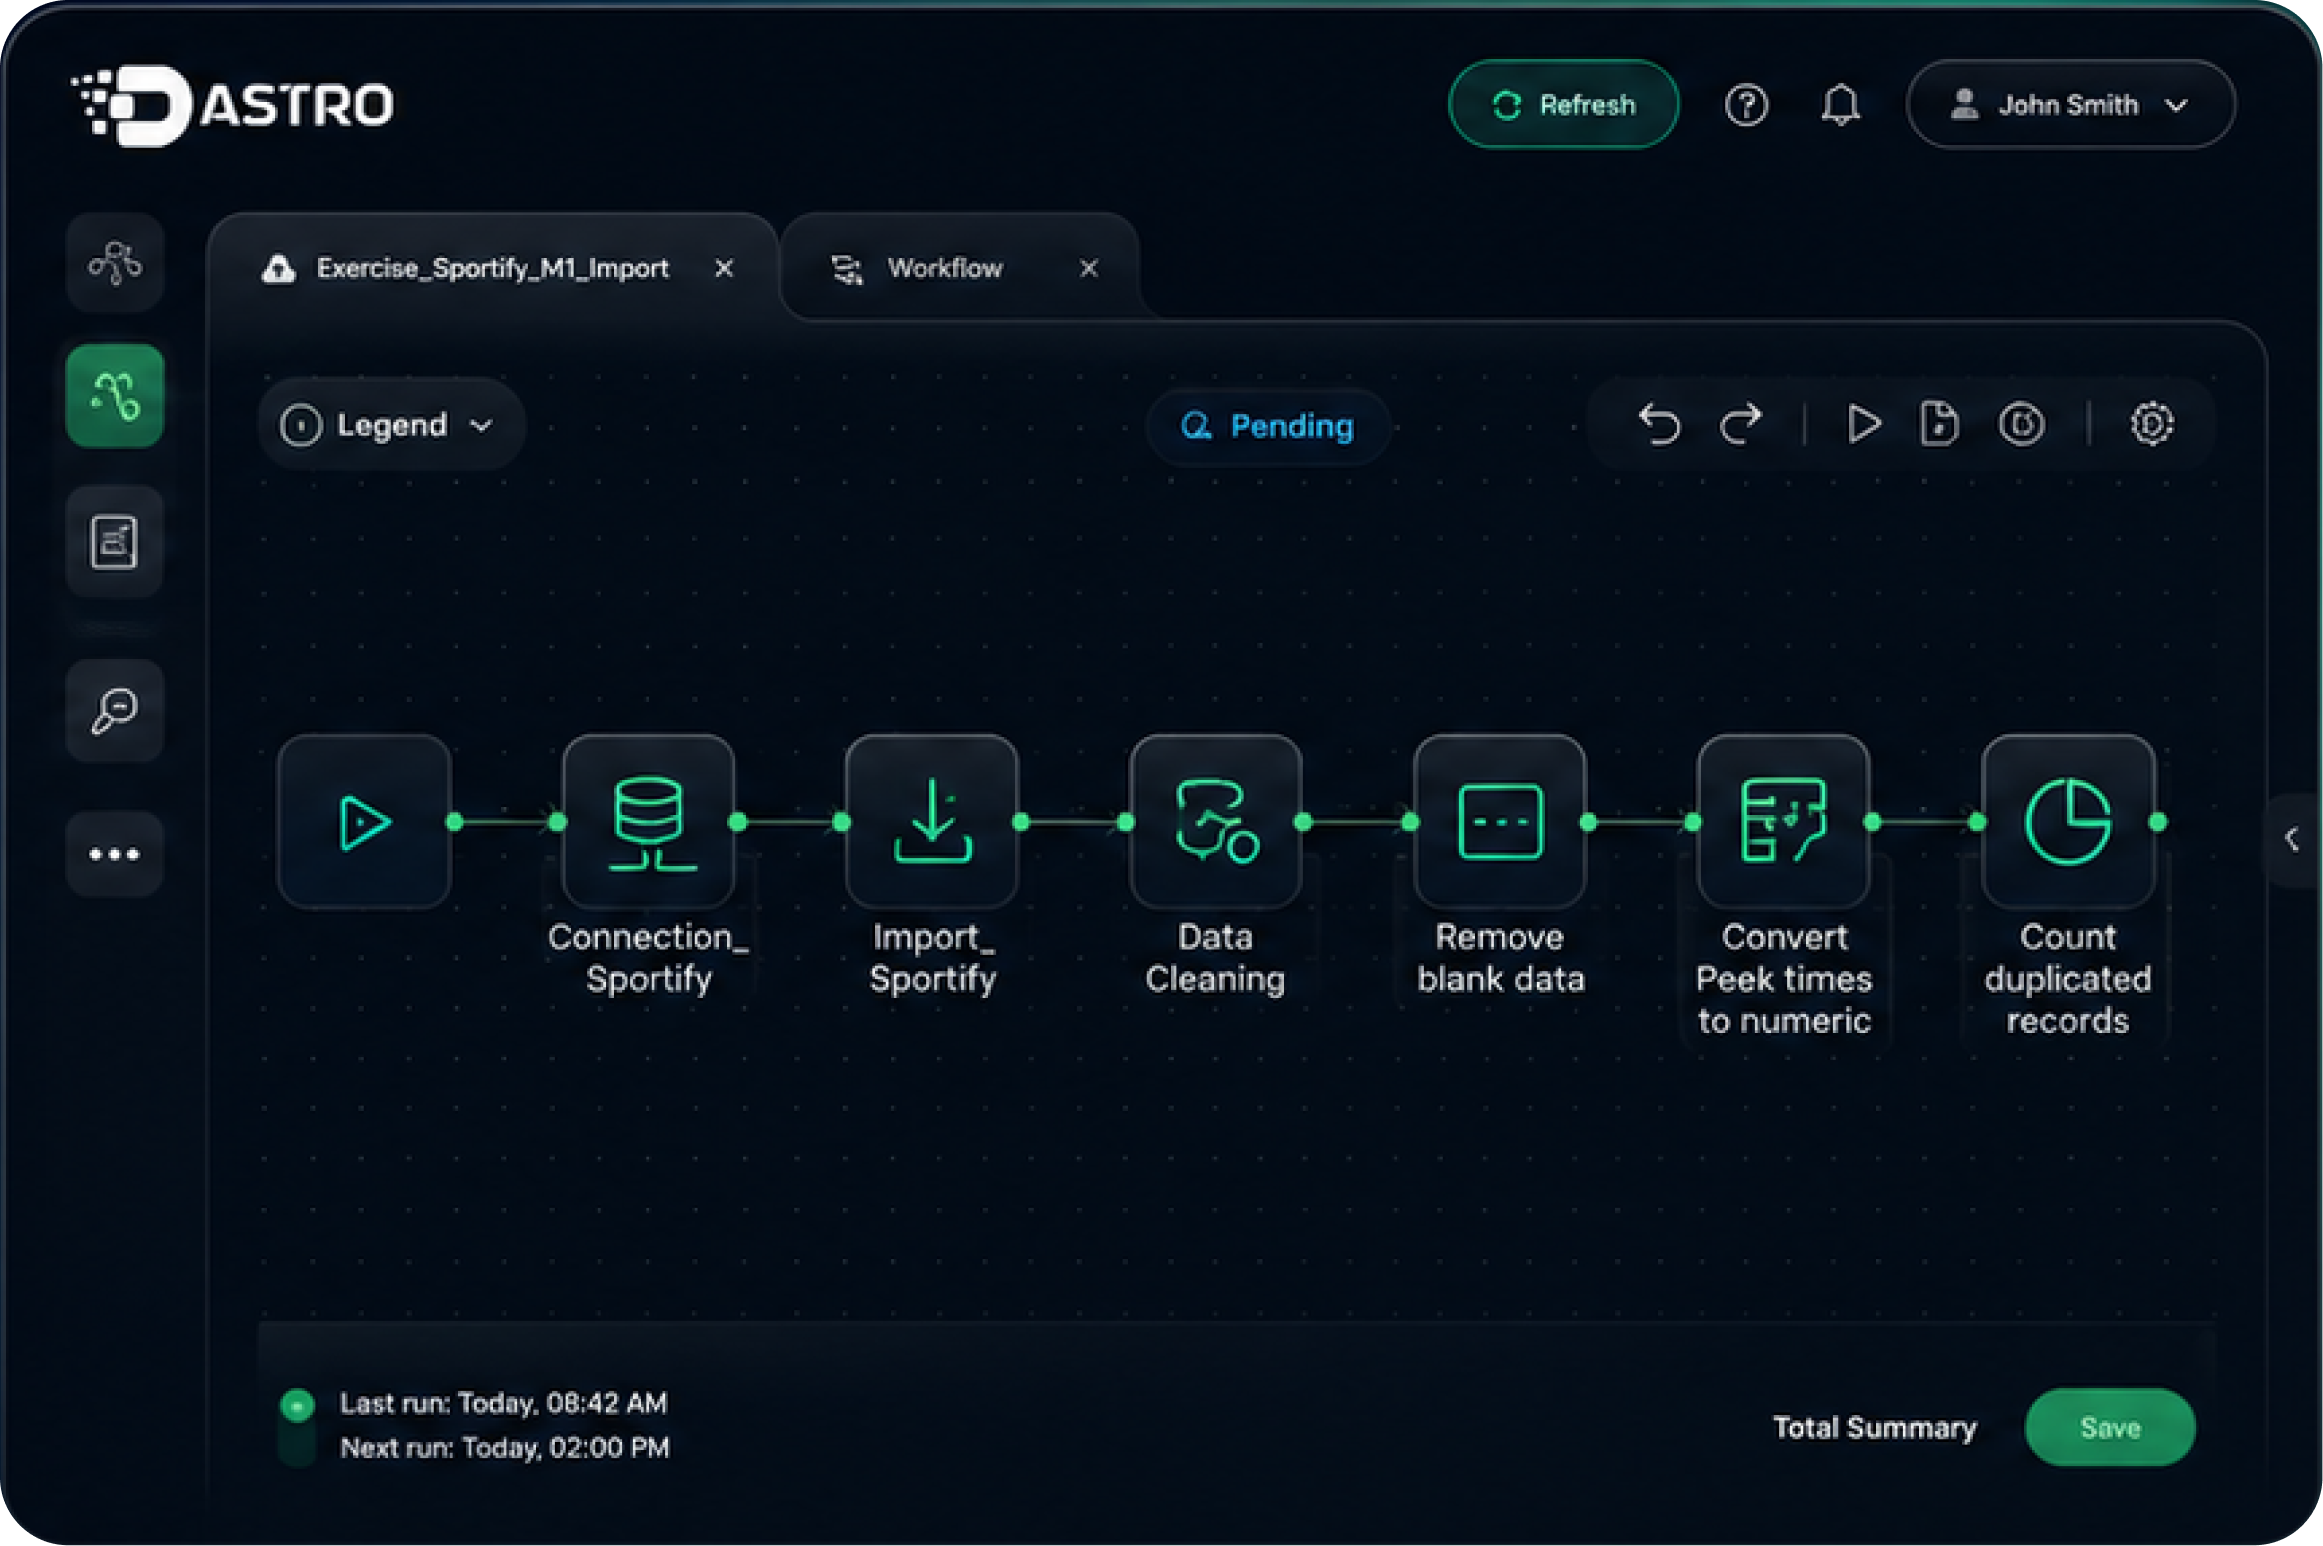
Dastro is Sophus’s cloud-based ETL and data management tool, fully embedded into Sophus X to automate data workflows end to end.

automatically extracts, cleans, and transforms raw ERP and financial data, no manual exports required.

Time savings
handles data prep and model refreshes on a schedule, so your team spends time on decisions, not spreadsheet wrangling.
Recognized by supply chain analysts and peers
Where buyers go to validate a vendor before they book a call.

4.8 ratings on Gartner Peer Insight
See it working in a real network
Consumer Goods
Same service, wildly different costs
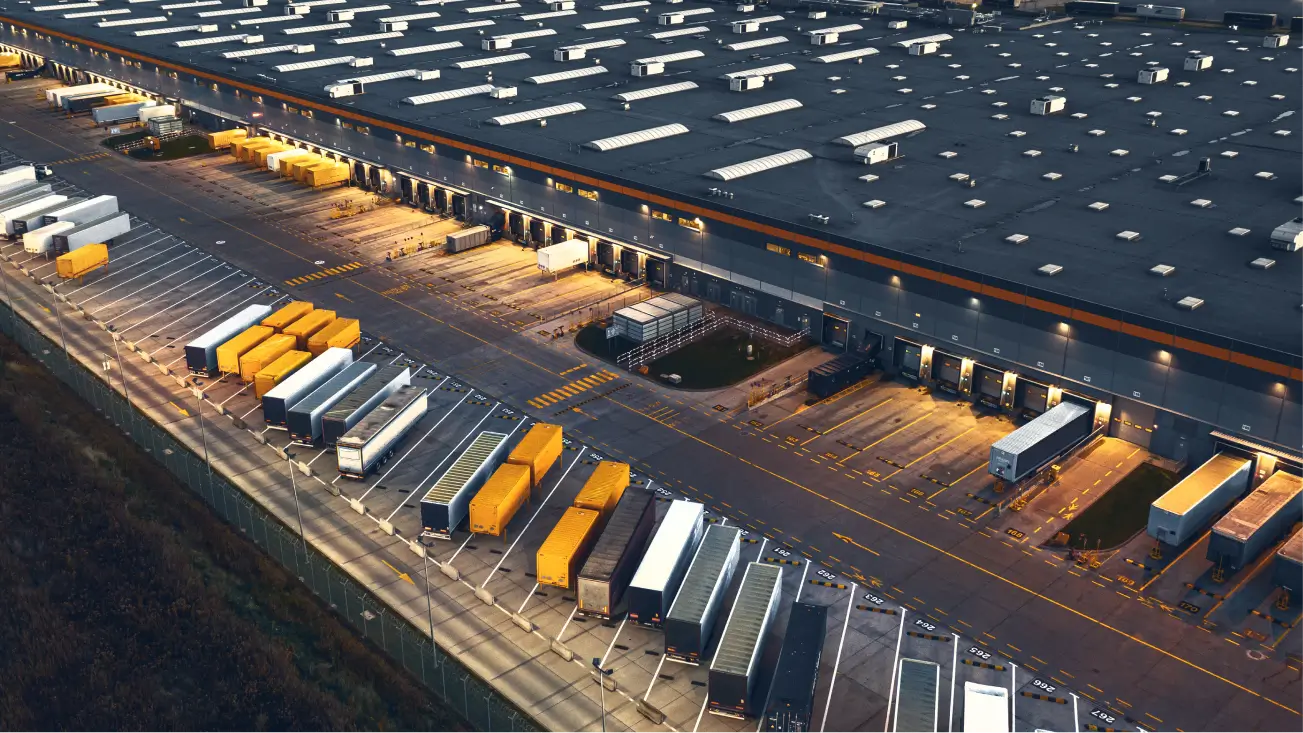
Despite rising sales, margins eroded because every region and channel got the same service, ignoring true cost-to-serve differences. Sophus built a digital twin with end-to-end cost-to-serve analytics, exposing hidden cost leakage across logistics, promotions, returns, and replenishment.
- 20% lower logistics cost, from eliminating inefficient routes and drops
- 29% lower write-off cost, from better demand-aligned inventory
- 30% better inventory turnover, unlocking capital and improving service reliability
Uniform service was quietly draining profit. Differentiated policies by channel and region restored margin growth.
Averaged pricing was hiding where the money leaked
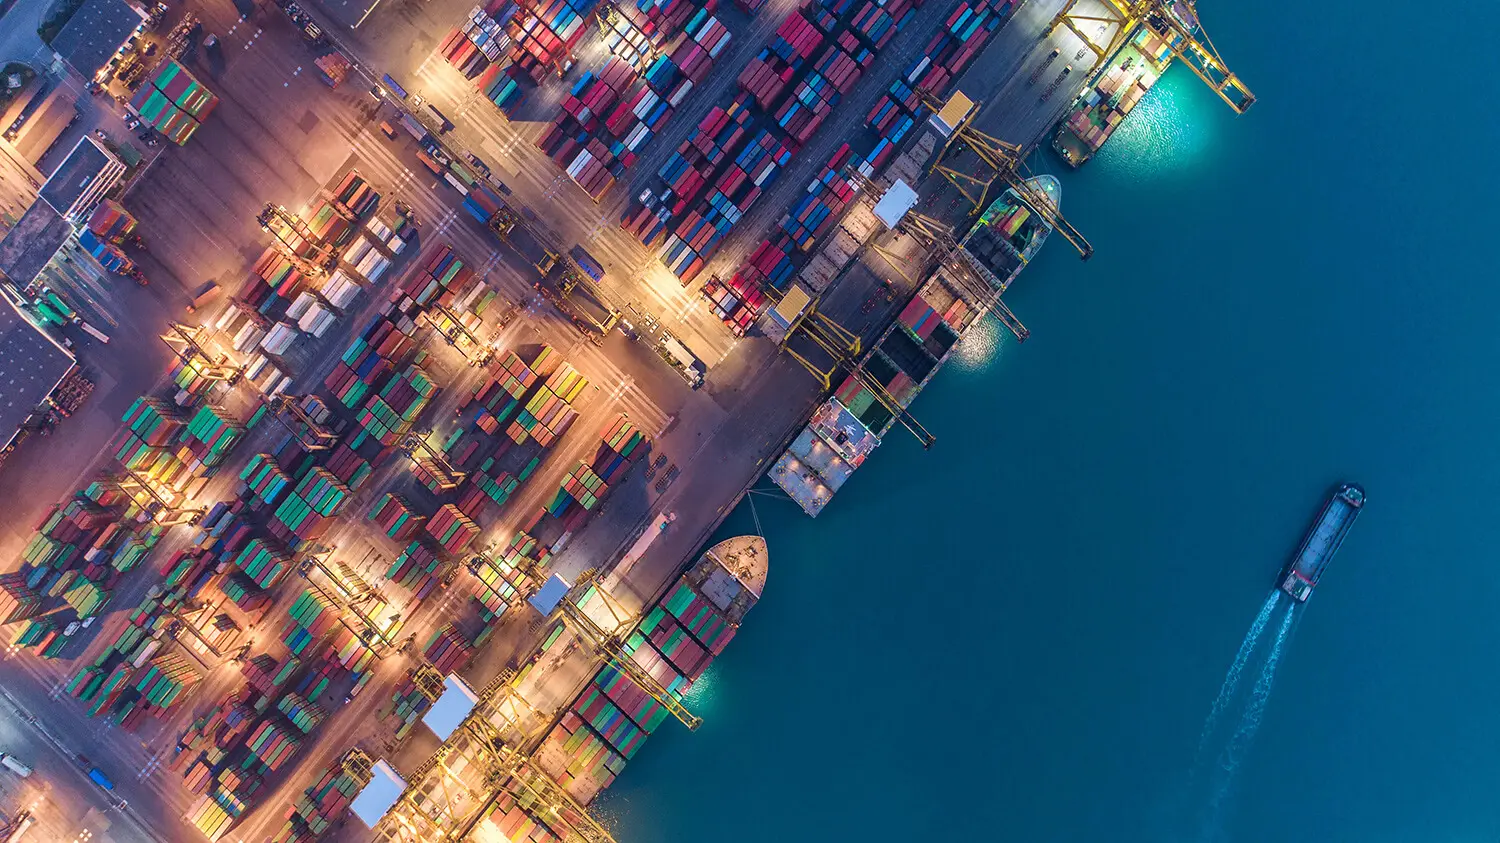
Margin compression came from averaged costing that masked real variability across collection, handling, sortation, linehaul, and last-mile delivery. Sophus built a granular digital twin allocating fixed and variable cost per parcel, factoring in route, product type, and region.
- Identified unprofitable rural regions and adjusted pricing and contracts accordingly
- Exposed large, non-conveyable items consuming disproportionate resources, enabling tiered pricing
- Delivered a strategic investment framework for infrastructure and automation decisions
Pricing shifted from reactive and market-driven to proactive and profit-driven, based on true cost drivers.
Pricing shifted from reactive and market-driven to proactive and profit-driven, based on true cost drivers.
Cost to serve feeds every decision downstream
Once true cost and margin are visible, they belong in your inventory, network, and sourcing decisions too.
Inventory Optimization
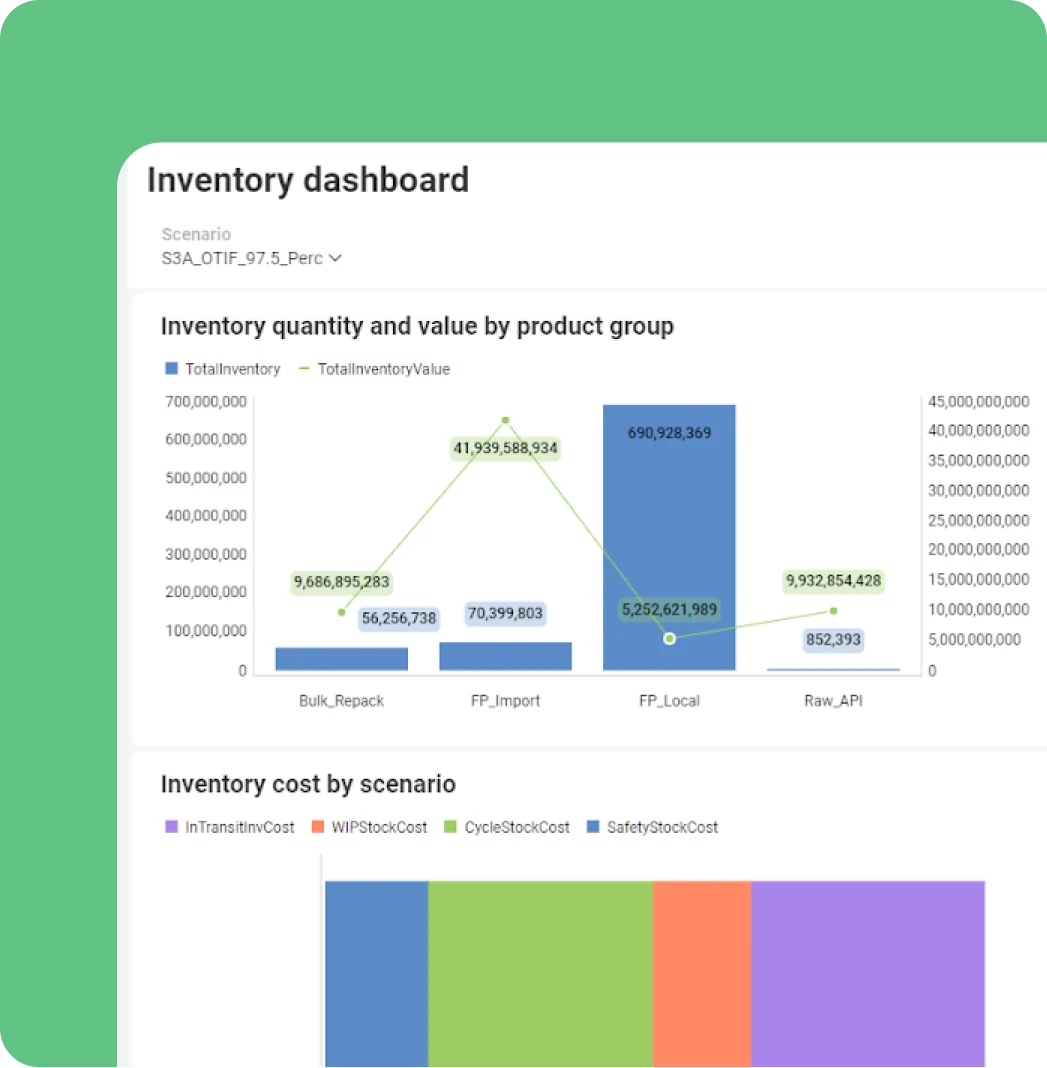
Turn cost-to-serve insight into where and how much to stock, by customer and channel.
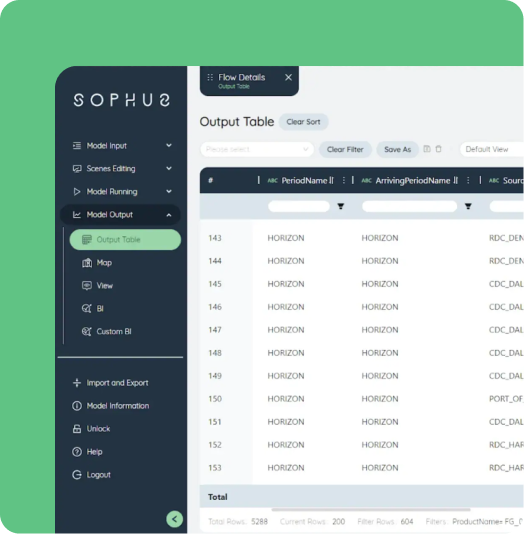
Sourcing Optimization
Fix cost at the source, before it ever reaches a customer’s order.
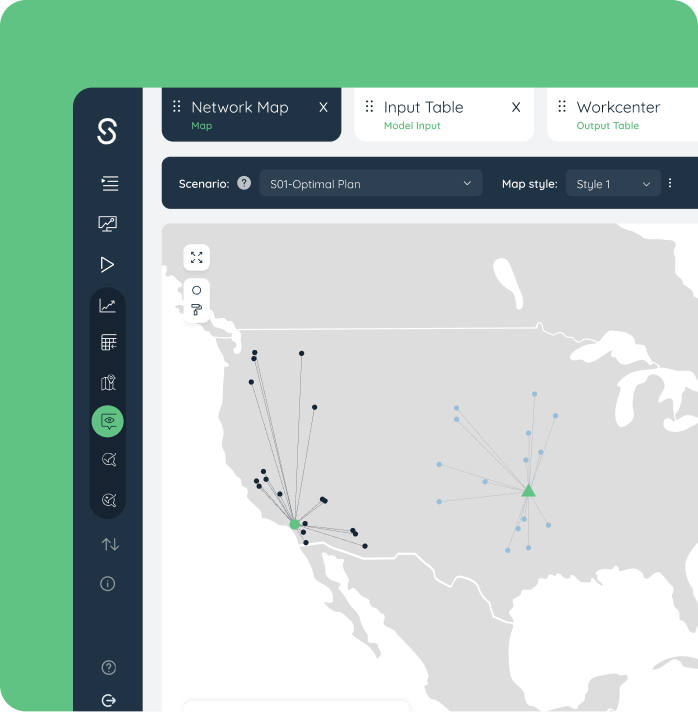
Supply Network Planning
Design the network your cost-to-serve data says you actually need.
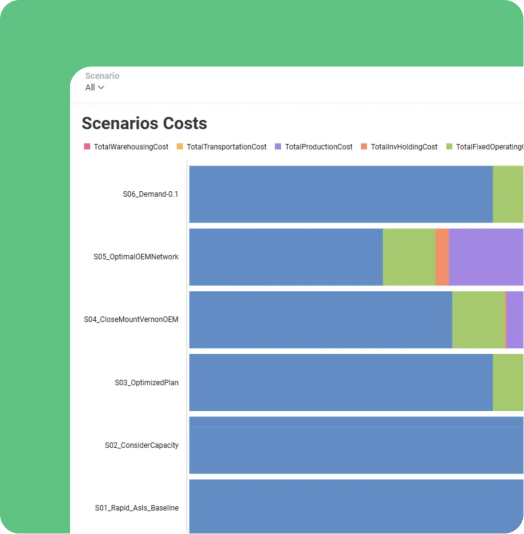
Tax and Duties Optimization
Capture landed cost accurately across borders, so true cost to serve holds up internationally.
Common questions on cost to serve
Some of your customers are quietly costing you money.