

Our customer, a consumer goods giant, distributed more than 200 active SKUs across a maze of regions and channels; hypermarkets, wholesalers, mom-and-pop stores, e-commerce players, pharmacy chains, and convenience networks. Volumes climbed year after year, products flew off shelves, and revenue charts kept their cheerful upward slope.
Yet profitability quietly slipped away.
And it slipped not because costs went up, nor because demand stalled, but because of a deceptively simple question:
“Do we understand the true cost of serving each region and channel and are we acting like we do?”
The Blind Spot: People don’t know the actual cost to serve
For years, the company had run its distribution like a city bus: same schedule, same stops, same rules for everyone. Whether a region demanded full-truck loads or tiny parcels, whether a channel was stable or wildly volatile, whether replenishment lanes were easy highways or winding rural roads, the company applied the same service expectations.
It was a philosophy built on fairness.
But fairness, as it turned out, was costing millions.
Some regions absorbed high logistics costs because of long-distance transportation loops. Some channels required dense, promotion-heavy activity.
Others demanded frequent replenishment with low order quantities — essentially burning margin with every delivery.
And some areas carried staggering return rates because product assortment didn’t match actual demand.
The biggest problem wasn’t operational inefficiency. It was invisible.
Executives simply couldn’t see the cost leakage because everything looked blended and averaged.
And averages — as supply chain people know — are where the truth goes to hide.
Turning on the Lights: What End-to-End Cost-to-Serve Really Meant
When the company deployed Sophus, they didn’t just “run a model.” They built a clear, end-to-end view of their network using supply chain digital twin modeling and cost-to-serve analytics—almost like installing an X-ray machine across planning, production, and distribution.
For the first time, every channel and region could be compared apples-to-apples through a full financial lens:
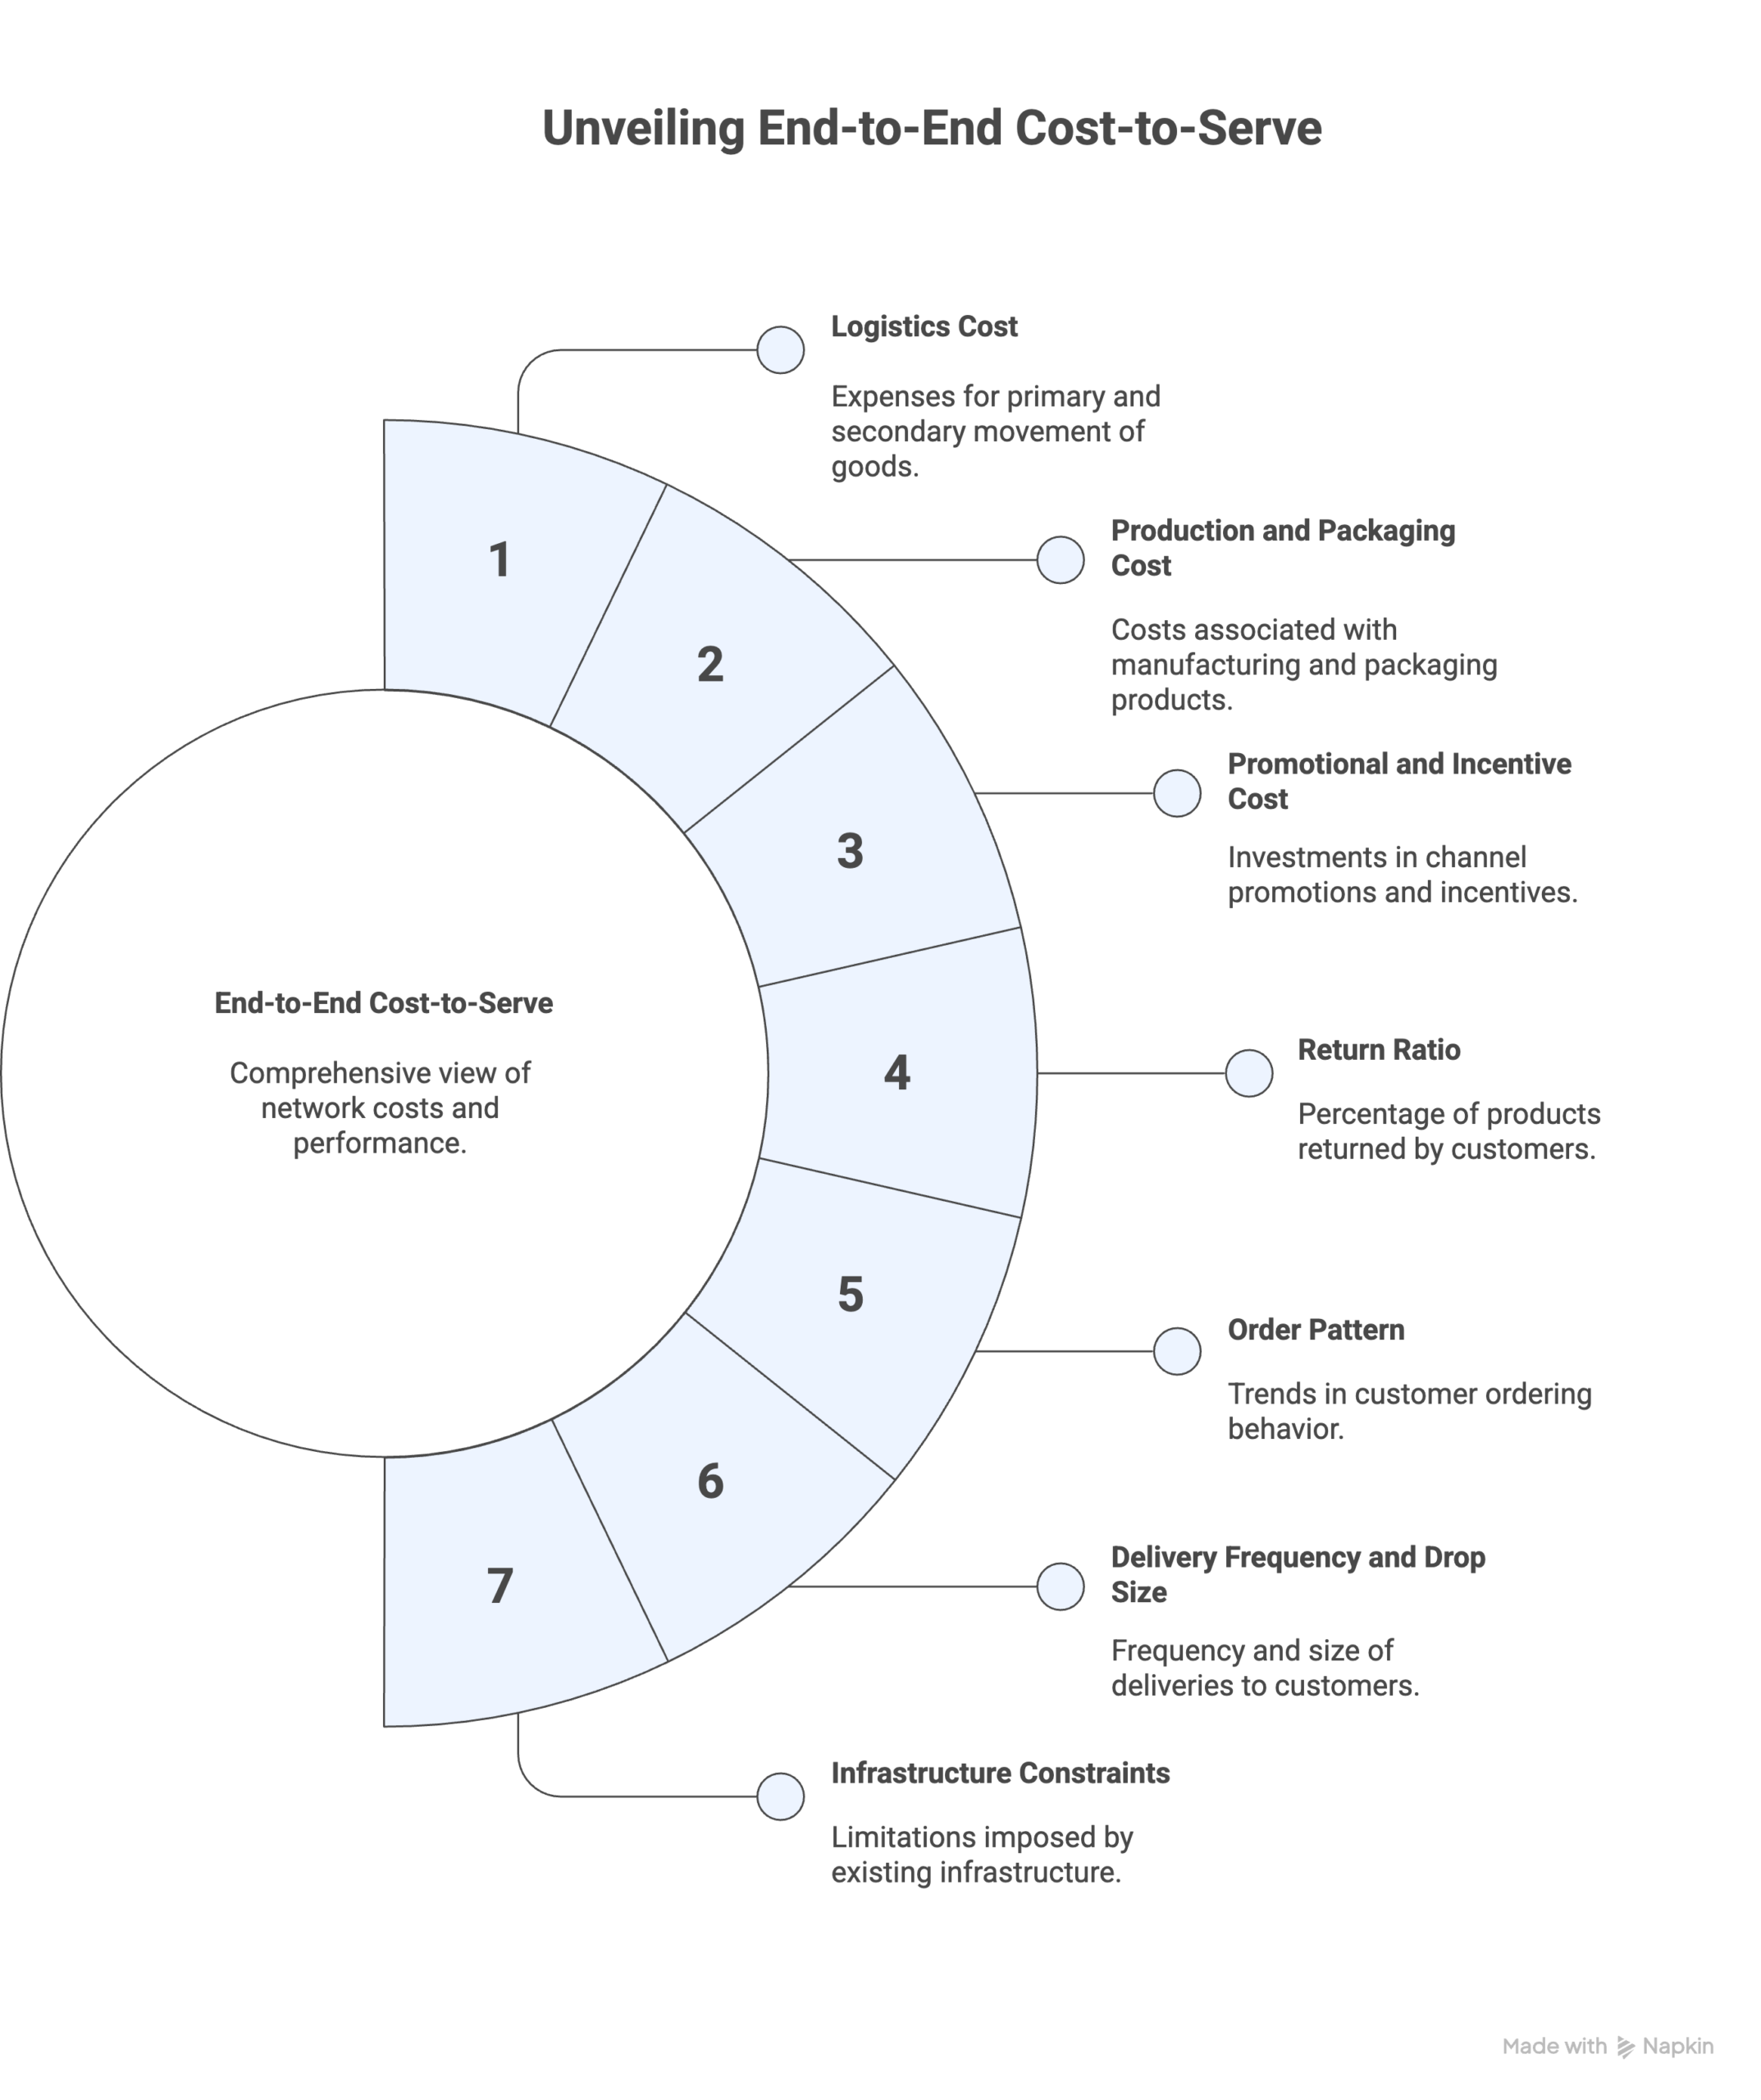
- Logistics cost (primary + secondary movement)
- Production and packaging cost
- Promotional and incentive to the channel
- Return ratio
- Order pattern
- Delivery frequency and drop size
- Infrastructure constraints
Instead of a single cost-to-serve number, the model produced a portfolio map showing the end to end cost to serve for each channel/product combination showing which areas were sunny and profitable, and which were brewing margin storms.
Some regions/channels were gems: high volume, predictable demand, minimal waste.
Others were burning cash: costly lanes, small drops, unstable orders, or heavy promotional dependency.
Channels behaved differently too — modern trade looked nothing like traditional trade; e-commerce demanded an entirely different cadence from pharmacy chains.
It was clarity — the kind the company had never possessed.
Differentiated Policies for Differentiated Customers
With the fog lifted, the company realized its national supply chain strategy resembled wearing the same coat in summer, winter, and a hurricane. It simply wasn’t built for the nuances of reality.
So the company redesigned its service strategy and not around customers, but around channel and regional archetypes.
Each segment received a different set of rules:
1. Minimum Order Quantities by Channel
High-cost regions no longer received tiny, margin-draining orders. Modern trade lanes aligned to pallet standards; rural distributors adopted higher MOQs to make transportation worthwhile.
2. Replenishment Frequency That Actually Made Sense
Daily trucks to slow-moving regions became a thing of the past. High-growth urban channels received more responsive cycles; distant regions shifted to economically efficient replenishment patterns.
3. Channel-Specific Promotional Investment
Promotions were no longer “blanket discounts.” The company could now assign marketing spend based on the actual ROI contribution of each channel.
4. Tailored Return & Expiry Policies
Regions with high expiry risk faced stricter rules; stable regions received more flexibility.
5. Inventory Allocation Based on Channel Value
High-reliability, high-volume channels earned priority allocation. Volatile or low-margin channels no longer drained safety stock reserves.
Execution: From Policies to Profit
Logistics Cost Dropped by 20%Because the company stopped driving empty miles to satisfy unrealistic frequencies and inefficient drops. Write-Off Cost Dropped by 29%Better alignment of inventory with real consumption patterns meant fewer returns and less obsolete stock. Inventory Turnover Improved by 30%Stock moved according to true demand velocity, unlocking working capital while maintaining service. |
And here was the twist:
None of this harmed service levels. If anything, service became more reliable because inventory flowed where it mattered most, transportation routes were purpose-built, and supply chain teams finally stopped firefighting
The Lesson: Equality Sounds Noble — But Fairness Saves the P&L
For years, the company equated uniformity with good service.
But uniformity is expensive in a world where channels behave differently, regions demand different rhythms, and logistics economics change every 50 miles.
The breakthrough wasn’t a new warehouse or new ERP. It was a new lens.
Cost-to-Serve showed the company that:
You don’t win by serving every channel the same. You win by serving each channel according to its true economics.
And once they embraced that truth, the margins finally stopped leaking and began to grow.