
Inventory Optimization Software
Inventory that knows where to sit, how much to hold, and when to move.
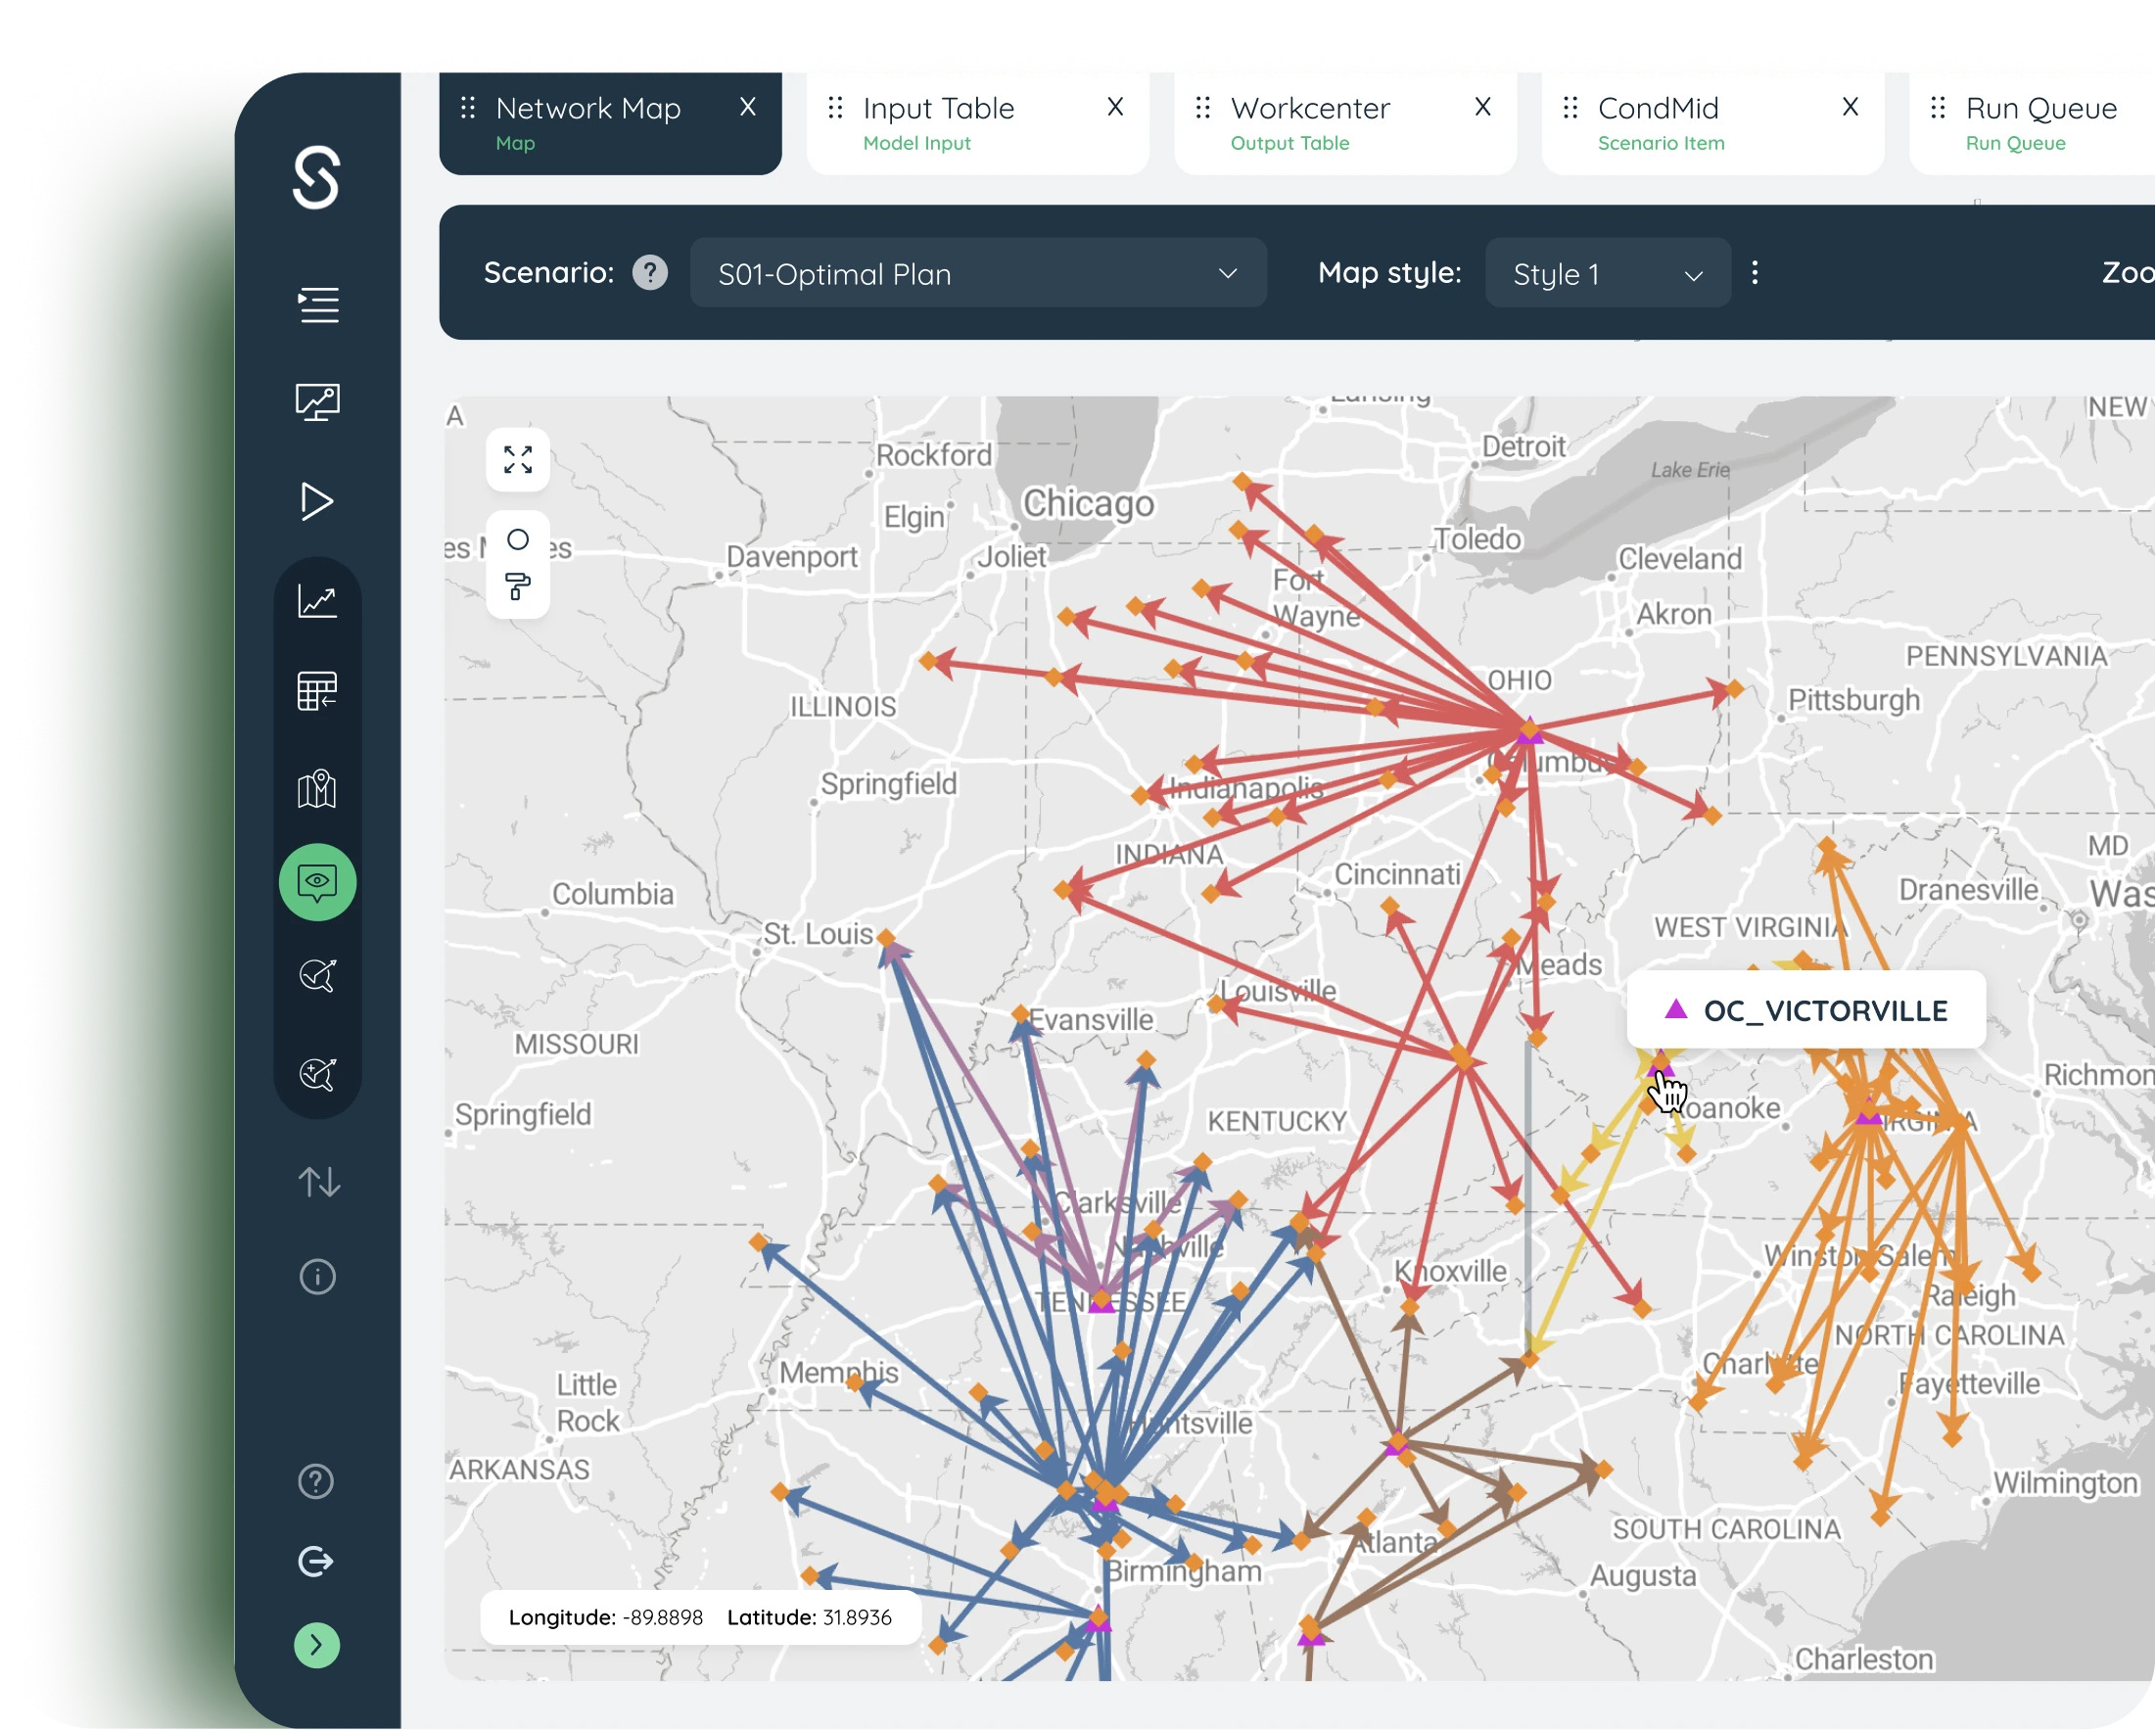
Sophus unifies multi-echelon inventory optimization, safety stock optimization, and replenishment into one AI-driven engine, so working capital funds growth instead of sitting in a warehouse.
20-25%
Inventory reduction
15-20%
Inventory turn improvement
30-50%
Customer service level improvement
Higher order fill rate
Trusted by Growing Companies at Every Stage of Network Design Maturity









Three Questions: One Impossibly Answer
Every Supply Chain/Planning leader is really trying to answer the same three questions: where should we stock it, how much should we stock, and when should we replenish it. The answers look simple. They rarely are, because each one is driven by a different web of interconnected variables.
Where?
Where to stock it
How much?
How much to stock
When?
When to replenish
Where to source and where to produce
Central DC vs. regional DC vs. store
Omnichannel and micro-fulfillment sprawl
Goods in-transit and in-process across the network
Forecasted demand and demand volatility
Demand forecast accuracy by SKU
Seasonality and MOQ / MPQ constraints
Service level requirements by SKU and customer
Lead times and lead time variability
Production lead time vs. source lead time
Non-substitutable or custom-made SKUs
Coordination across functional groups
Sophus Solution
One model, three decisions, solved together.
Multi-echelon inventory optimization, safety stock optimization, and Replenishment used to live in three separate exercises. Sophus runs them as one connected model, so a change in one answer automatically updates the others.
Multi-Echelon Inventory Optimization
Model your full network, from central DC to regional DC to every node between, and get a recommendation for where each SKU should sit and how it should be replenished, not location-by-location guesswork.
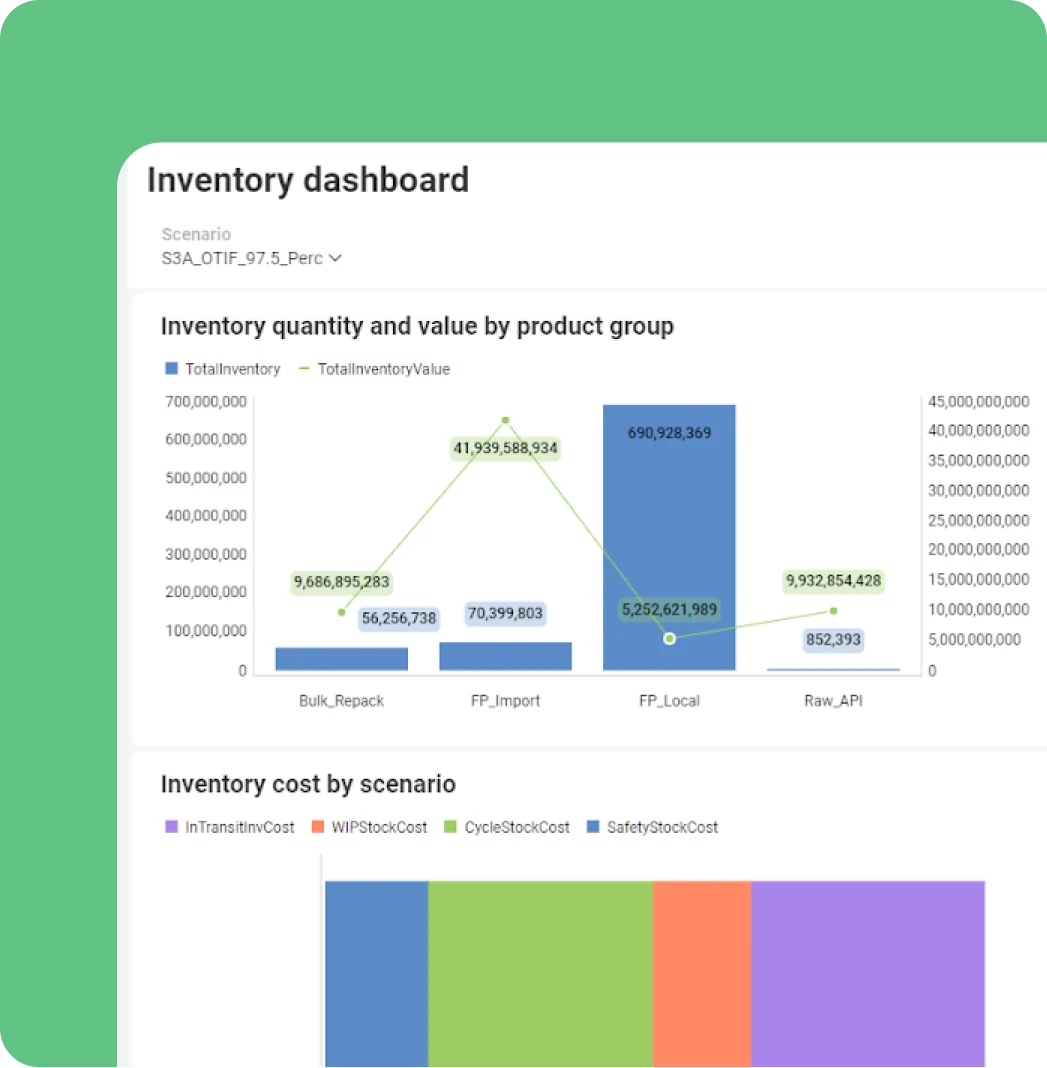
Safety Stock Optimization
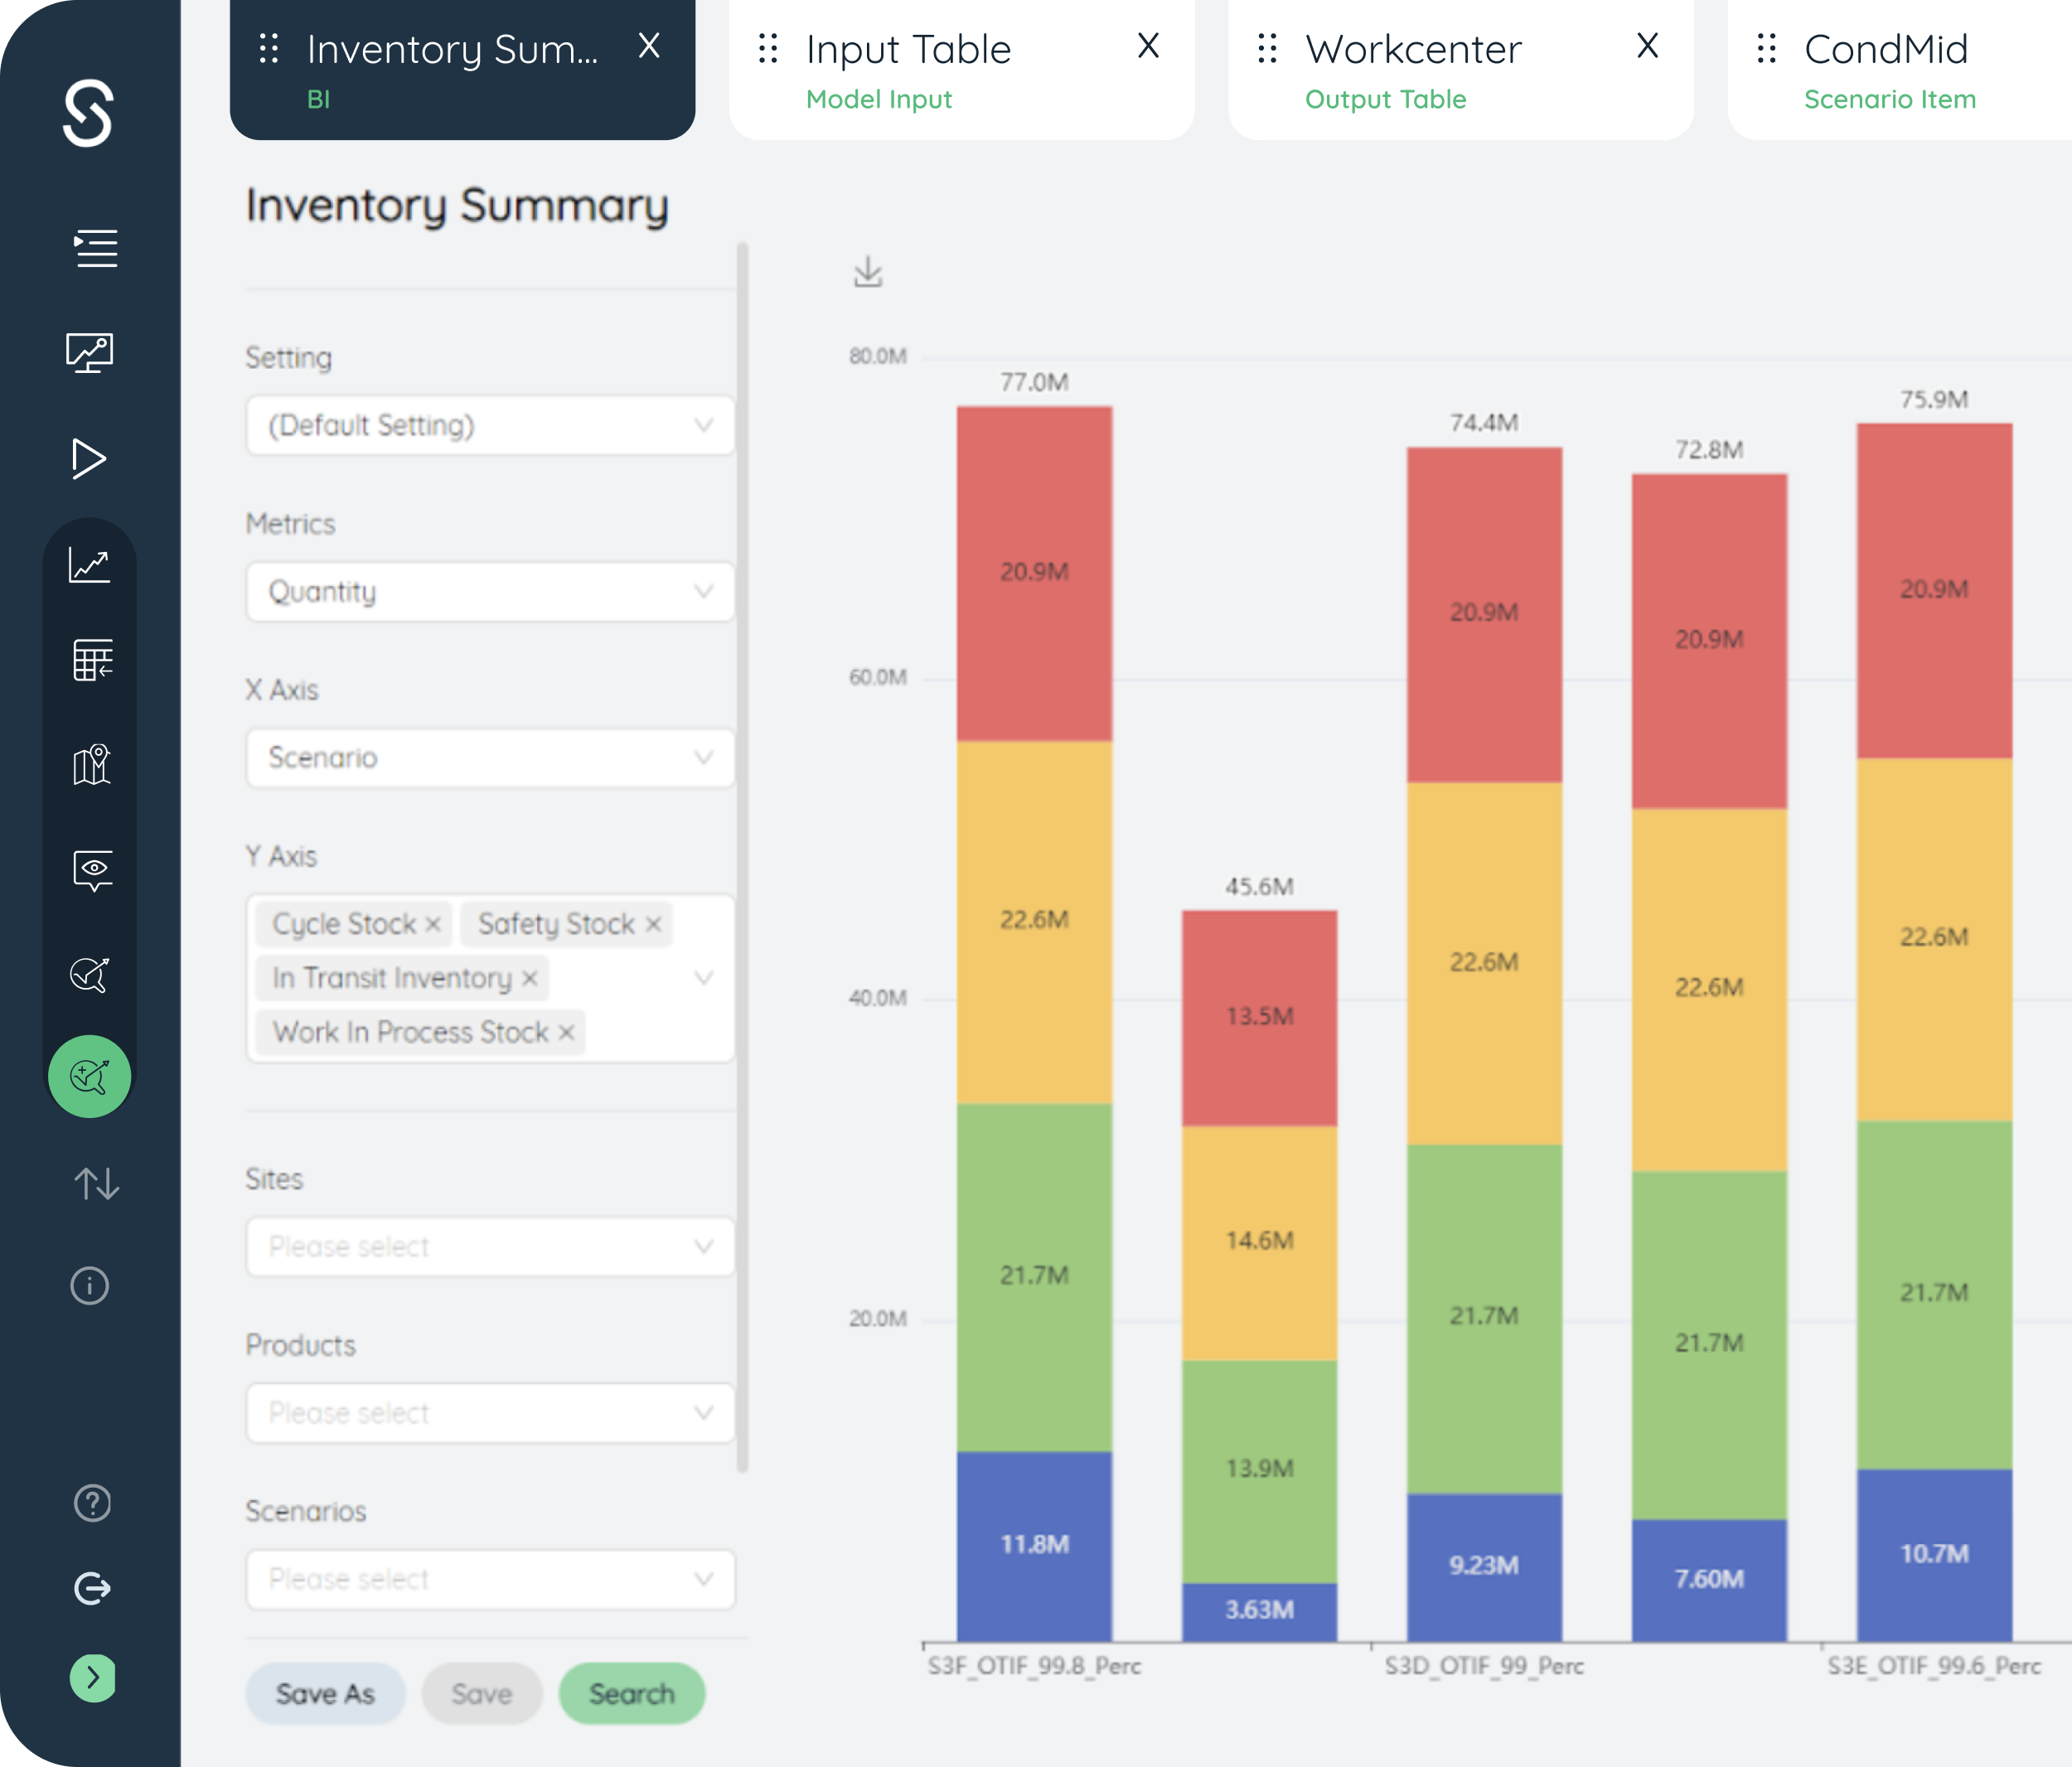
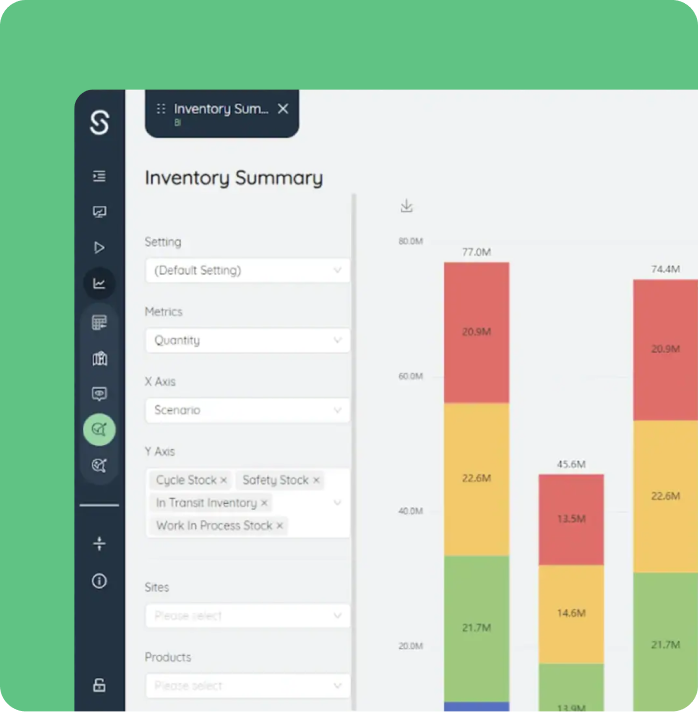
Calibrate safety stock at the SKU-location level to hit your service level agreement at the lowest possible cost, accounting for demand variability and lead time variability, down to the individual node.
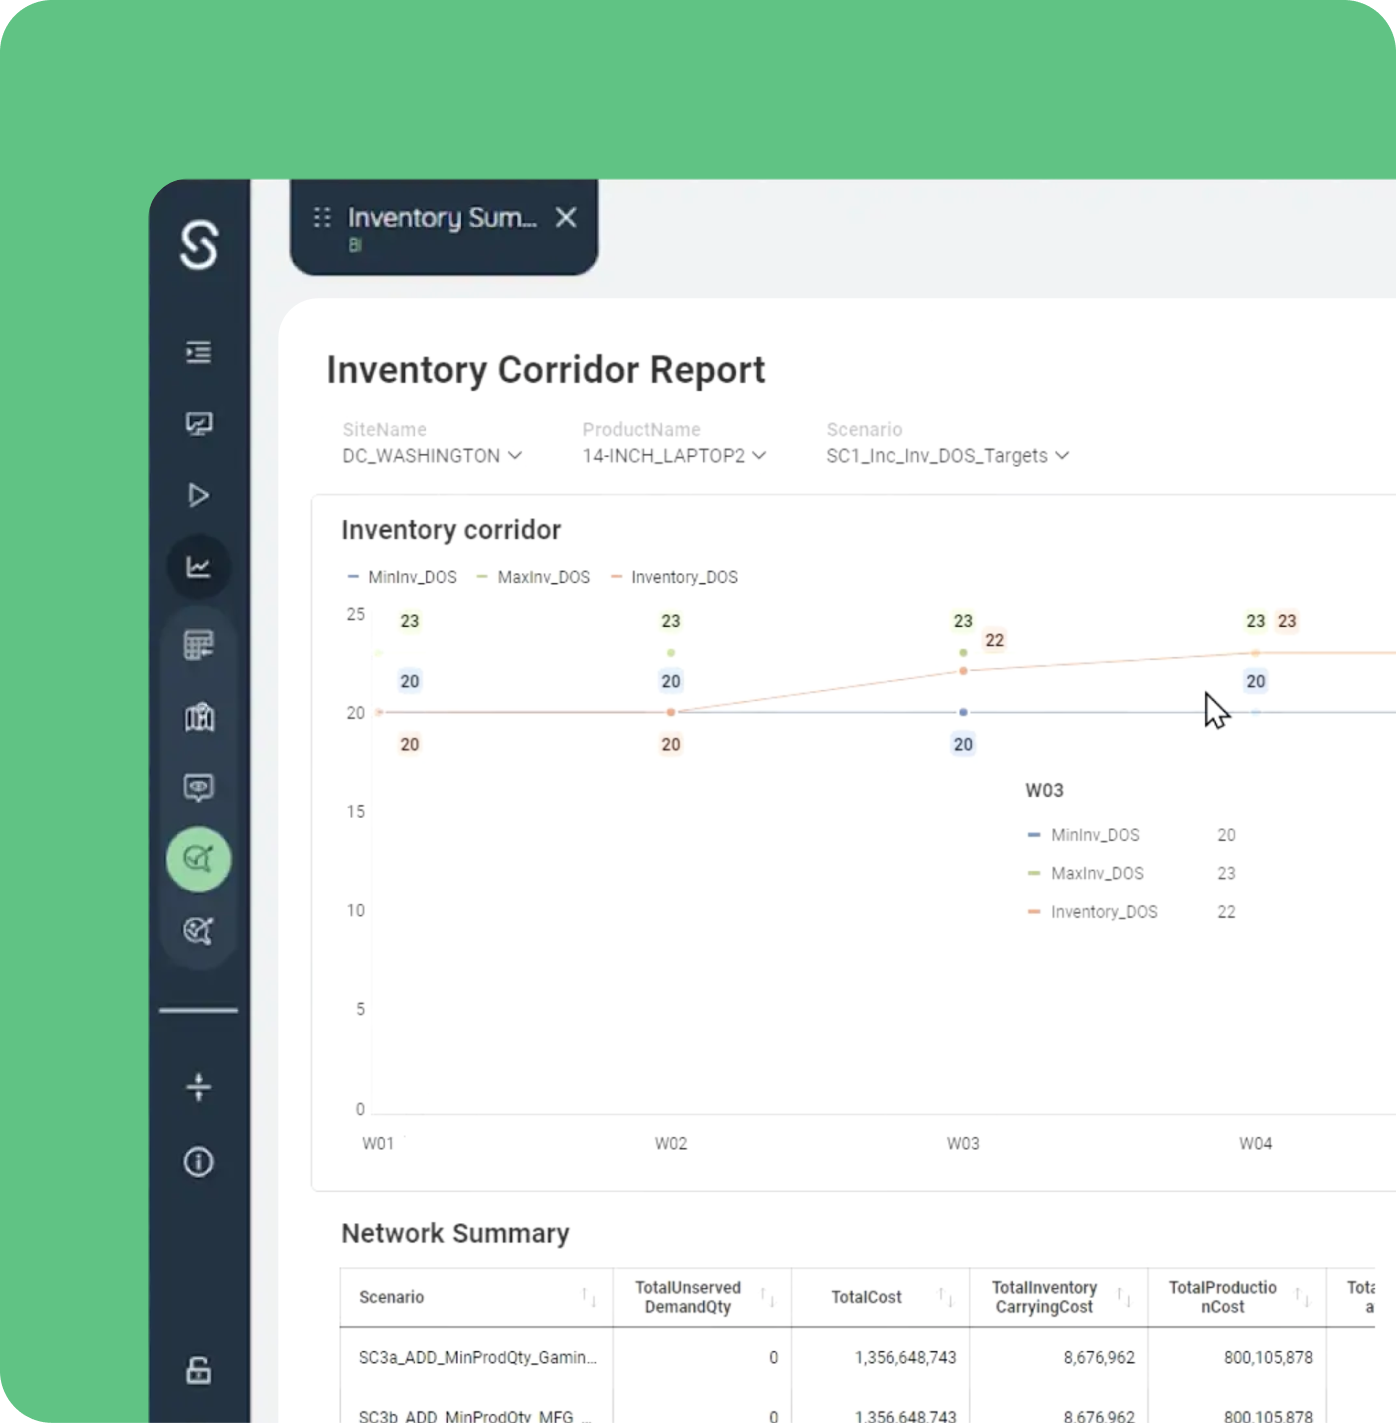
Segmentation & Replenishment
Classify every SKU by demand pattern, value, and order frequency, then time replenishment and reallocation so capital keeps moving instead of sitting on a shelf.
Why sophus
Because these three decisions shouldn’t live in three tools.
Most teams solve where, how much, and when with separate spreadsheets, separate point tools, or a planner’s judgment. That works until the network changes, and it always changes.
The Old Way
Point-in-time planning
One policy for every SKU
Disconnected tools
The Sophus Way

Continuously updated

Segmented to the SKU-location

One connected model
Every recommendation is a trade-off, made for you
The Sophus Decision
Hold more safety stock to protect service levels, or free up working capital
Right-size safety stock per SKU-location to hit your SLA at the lowest cost, not both extremes
Stock centrally for efficiency, or regionally for speed
Place each SKU at the echelon that matches its demand pattern and required response time
Replenish on a fixed schedule, or react to every demand signal
Time replenishment to SKU segment: fast movers get tighter cycles, slow movers get wider ones
Treat every SKU the same, or build a custom policy for each
Segment SKUs automatically by value, volatility, and order frequency, then apply the right policy to each group
How Sophus gets you there
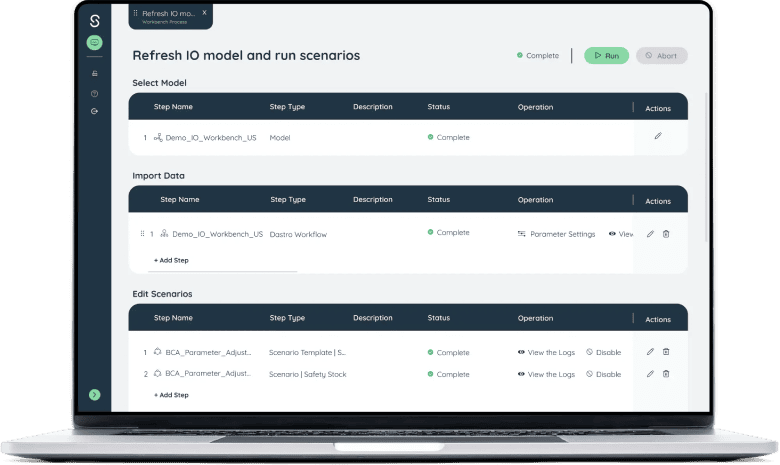
A single, repeatable workflow, from raw sales data to a replenishment plan your team can execute this week.

Segment
Product/SKU segmentation based on demand pattern, order frequency, and value.

Model the network
Multi-echelon modeling across every node, lane, and lead time in your supply chain.

Calibrate safety stock
SLA-aware safety stock per SKU-location, sized to actual demand and lead time, variability.

Recommend & reallocate
Concrete replenishment quantities, reorder points, and inventory reallocation plans.
Patterns we see across complex, multi-SKU networks

Cutting safety stock without missing seasonal peaks
Separating true demand volatility from forecast bias lets teams hold less buffer stock year-round while still protecting service levels during seasonal spikes.
Lower safety stock
Protect peak demand
Protecting service levels on custom, non-substitutable SKUs
Sizing safety stock per SKU-location, instead of a blanket policy, shrinks redundant buffers on interchangeable parts while safeguarding the SKUs that can’t be swapped.
SKU-level buffers
Protect critical SKUs


Shifting inventory out of regional DCs without breaking SLAs
Multi-echelon modeling identifies which regional buffers are redundant with central stock, freeing capital without adding delivery risk.
Reduce regional stock
Protect SLAs
Inventory optimization doesn’t work in isolation
It connects to how you design your network, forecast demand, move product, and manage risk. Explore the rest of the Sophus platform.
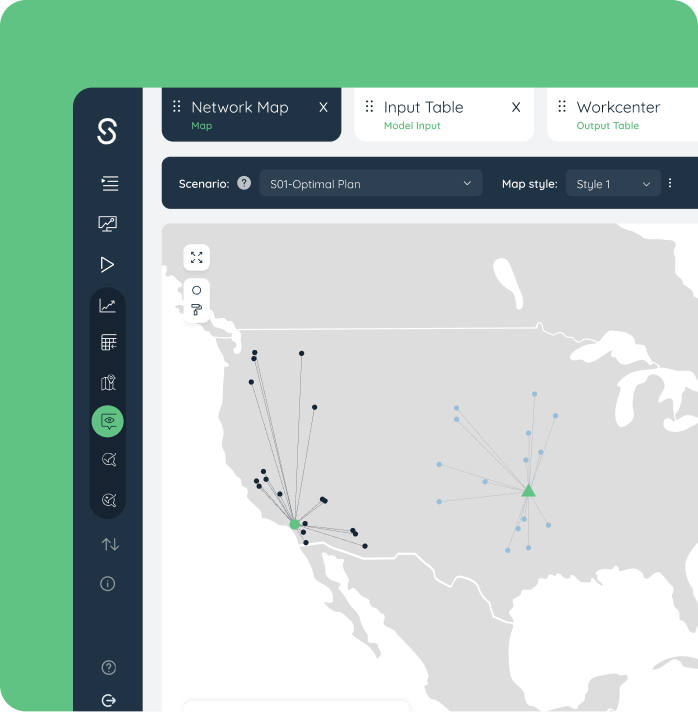
Network Design
Decide where DCs and plants should sit before you optimize what’s inside them.
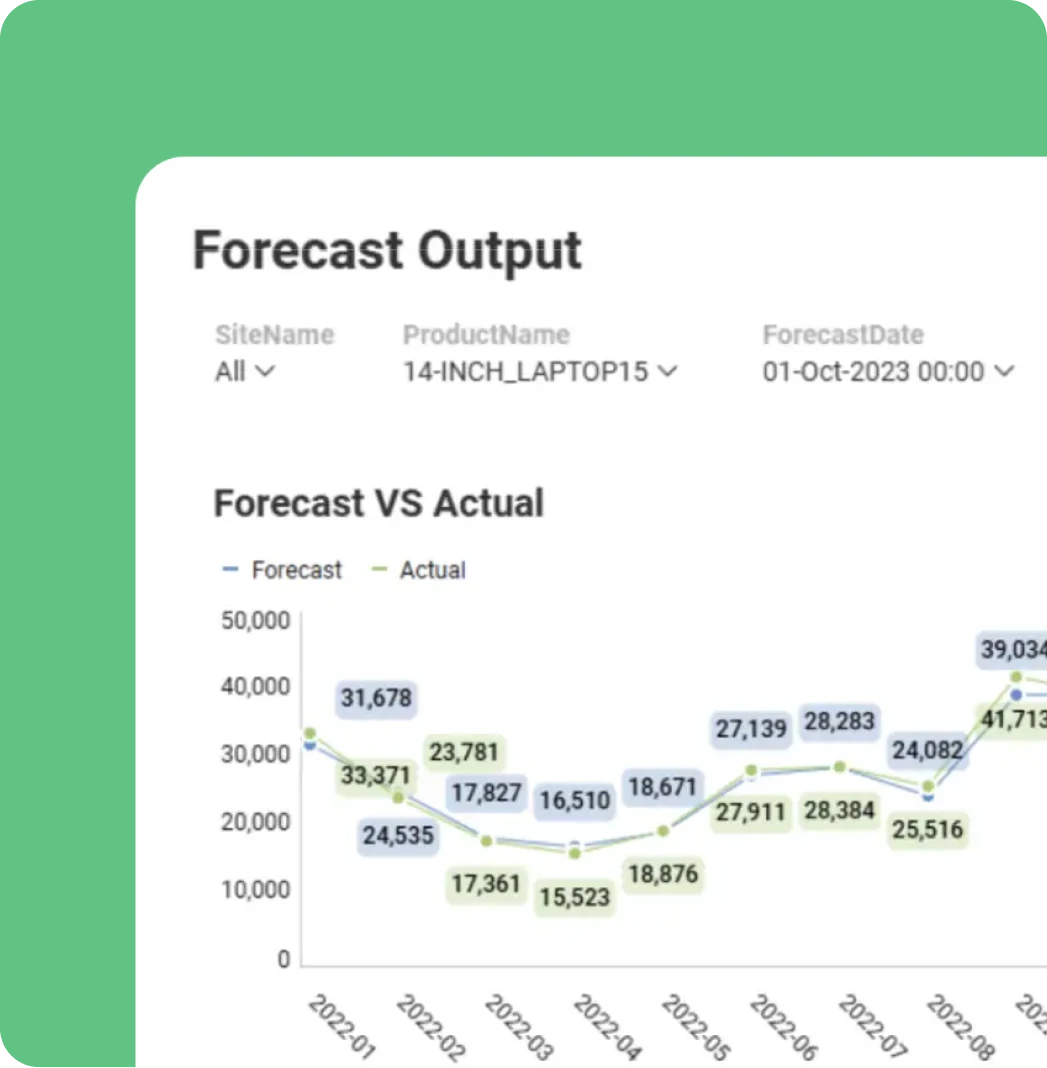
Demand Forecast
Feed inventory optimization with sharper forecasts and a realistic replenishment cadence.
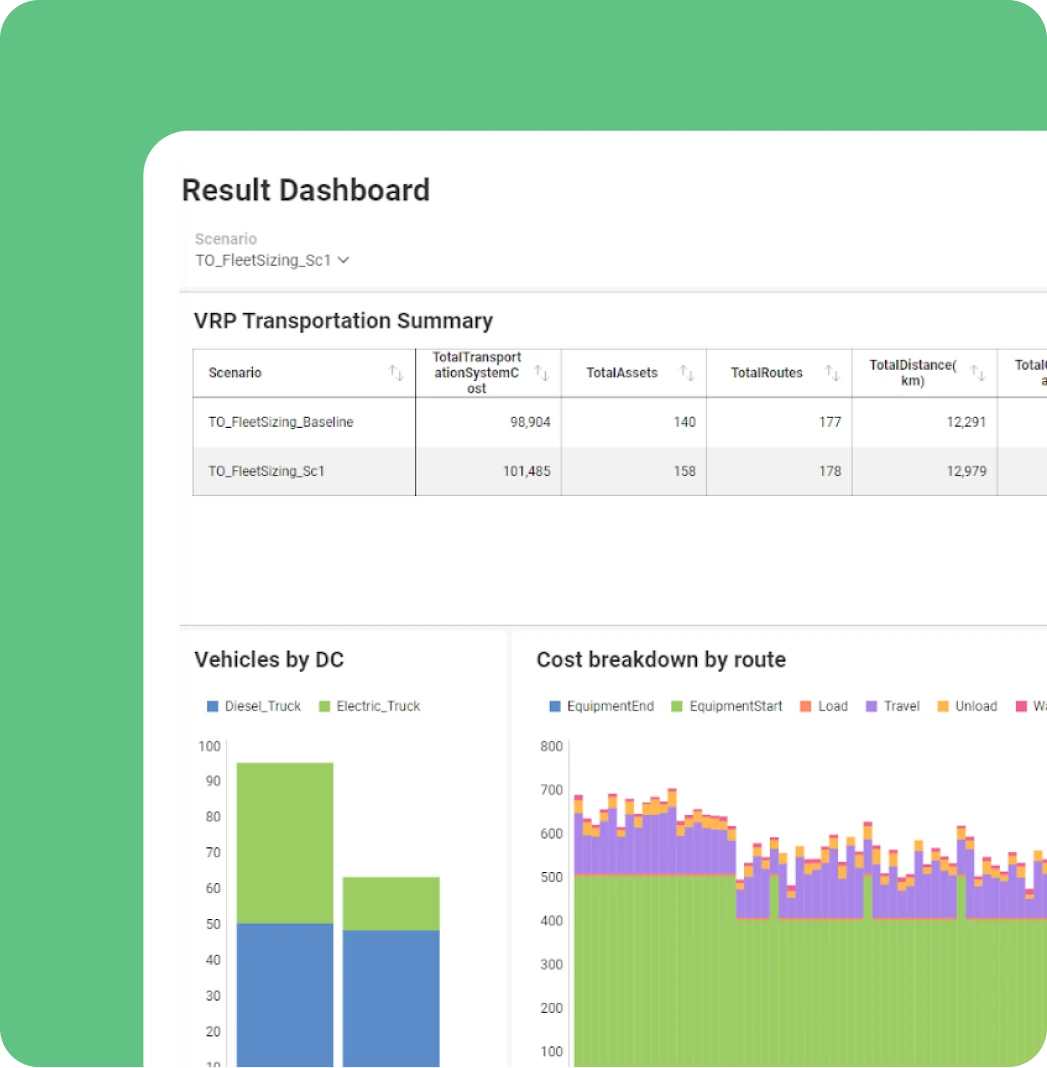
Logistics Optimization
Move inventory efficiently once you know exactly where it belongs.
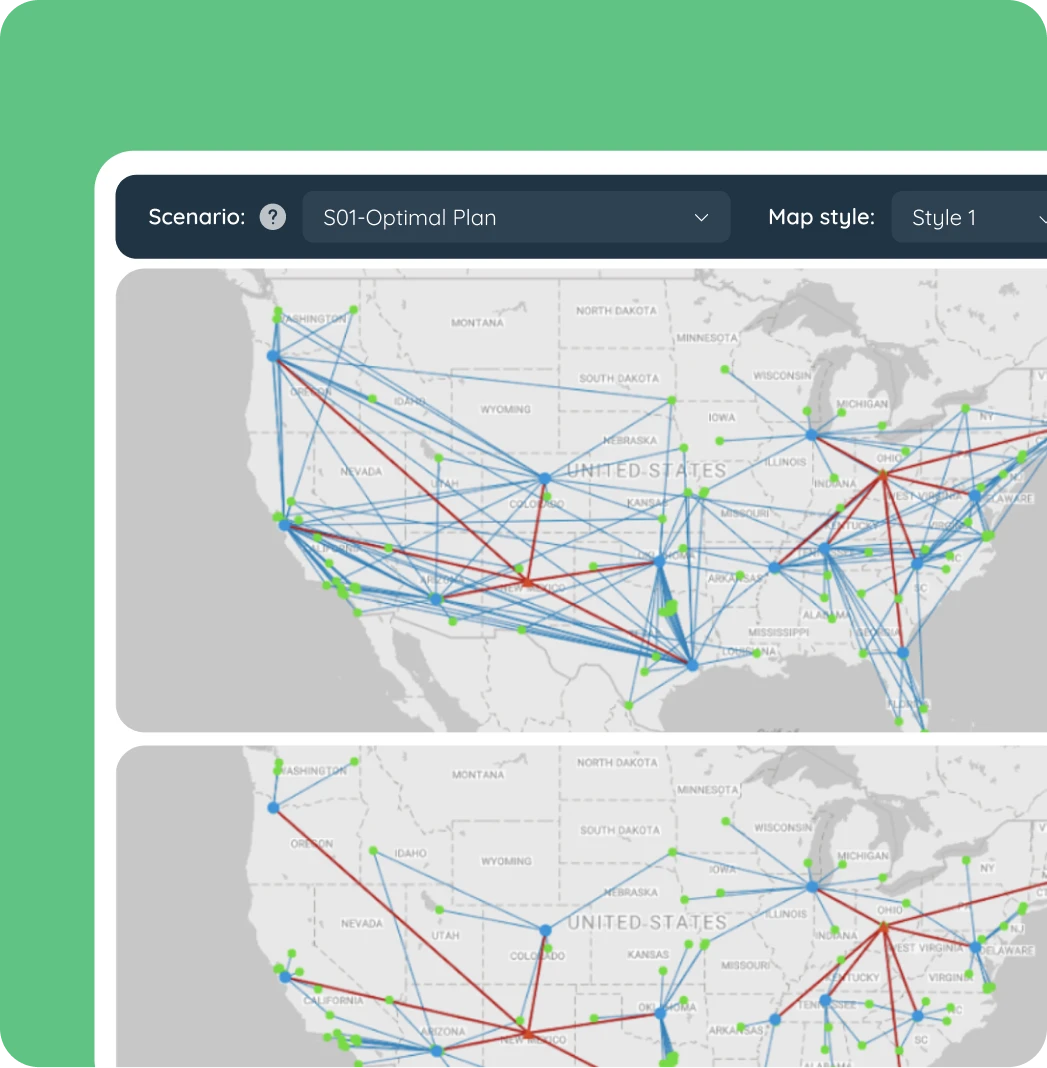
Risk & Resilience
Stress-test your inventory strategy against disruption and sustainability targets.

Find out how Sophus keeps your inventory where it belongs
Tell us about your network and we will follow up with what an optimized version could look like, no meeting required yet.
What Verified Users Say on Gartner

4.8 ratings on Gartner Peer Insight
Common questions on inventory optimization
Stop guessing.
Start Optimizing.
See how Sophus turns your demand, lead time, and network data into a concrete inventory plan: where to stock, how much, and when.