


Most companies know their product costs down to the penny by telling you how much to make one product and what the raw material cost. But only fewer can really tell what it actually costs to serve their most demanding customer versus their most efficient one and that gap is where margin quietly disappears.
Cost-to-serve solutions map the true cost of getting products to specific customers, channels, and regions, revealing profitability that traditional accounting obscures. This guide covers how to calculate cost to serve, the key drivers that inflate it, and how to turn visibility into action through pricing, network design, and service differentiation.
Cost to Serve Solutions: A Detailed Overview
Cost-to-serve solutions are analytical frameworks and software tools that map, measure, and optimize the end-to-end costs of delivering products to customers. These solutions cover logistics, manufacturing, and support activities to enhance profitability. They identify hidden expenses, inform pricing strategies, improve supply chain efficiency, and boost customer-level profitability.
Cost to serve goes beyond product cost. It captures every activity required to get a product into a customer’s hands—product cost (often called cost of goods sold), warehousing, transportation, returns, promotions and marketing expenses, depreciation of the assets and customer service all factor in.
- Cost to serve definition: The total end to end cost incurred to deliver a product or service to a specific customer, channel, or product line.
- What it includes: End to end costs to serve products to a customer, not just the cost of goods sold.
- Why it matters: It reveals which customers, channels, or products actually generate profit versus those quietly draining margin.
Why Cost-to-Serve Matters in Corporate Profitability
Traditional accounting often hides true profitability by averaging costs across all customers. You might see a customer generating $2 million in revenue and assume they’re a top performer. But what if serving that customer costs $1.9 million?
This is the old way: blanket pricing and averaged logistics costs that obscure financial reality. The result? Companies unknowingly subsidize unprofitable customers with margin from profitable ones.
The new way provides granular cost-to-serve visibility. When you understand the true cost of serving each customer, you can make smarter trade-offs between pricing, service commitment and profitability. Some customers deserve premium service and a higher subsidy. Others might warrant repricing—or a conversation about order minimums.
Common Cost-to-Serve Drivers and Expenses
Cost to serve in supply chain operations falls into distinct categories. Understanding these drivers is the first step toward managing them.
Transportation and Freight Costs
Delivery frequency, distance, shipment size, and mode selection all impact what it costs to serve different customers. A customer requiring daily small shipments to a remote location costs significantly more than one accepting weekly consolidated deliveries nearby. The math is straightforward, but most companies don’t run it at the customer ship to level, or often the case they can’t because cost of freight often aggregated,
Note that transportation and freight costs also include inbound costs into the DCs or hubs.
Related read: Last-Mile Delivery: Route Optimization Guide
Warehousing and Fulfillment Costs
Storage, picking, packing, and labor add up fast. Order complexity and SKU proliferation drive variability here. A customer ordering 50 SKUs in small quantities creates more fulfillment work than one ordering 5 SKUs in bulk. Same revenue, very different cost to serve.
Also lots of costs such as storage or facility rental is a fixed cost but should be allocated to the customers as well as a cost to serve elements.
Returns and Reverse Logistics Costs
Returns processing, restocking, and disposal are often-hidden costs. High-return customers can quietly erode margin even when their gross sales look healthy. If you’re not tracking returns by customer, you’re missing a big piece of the picture.
Promotion/subsidy
Lots of promotion and subsidy will go to customers/channels/retailers without knowing the end to end margin impact. It may help to increase sales and it may make perfect sense but it is very valuable to include this as the end to end cost to serve for the customer/product.
Depreciation (fixed cost)
Whether it’s the fixed costs of the production lines or the depreciation of the manufacturing facility, these expenses must be integrated into the Cost to Serve (CTS). In many organizations, Capital Expenditure (CapEx) depreciation is allocated across the supply chain; identifying the source of this depreciation—whether it originates in the plant or the warehouse—is critical, as it directly dictates the cost profile of the product based on its flow path.
Service Level and Customization Costs
Expedited shipping, custom packaging, special labeling, and dedicated inventory all add cost layers. Standard pricing rarely captures these extras—which is exactly why cost-to-serve analysis matters.
How to Calculate Cost to Serve
Accurate cost-to-serve analysis requires moving beyond simple allocation to activity-based methods. The difference between good and bad cost allocation is the difference between insight and noise.
Activity-Based Costing Methodology
Activity-based costing (ABC) assigns costs based on the actual activities consumed rather than through arbitrary allocation. Instead of spreading warehouse costs evenly across all customers, ABC links expenses directly to the actions that drive them.
For example, if Customer A requires 10 picks per order and Customer B requires 100, ABC captures that difference. Traditional allocation would miss it entirely. ABC is the foundation of accurate cost-to-serve models because it connects expenses to the work that creates them.
Segmenting Costs by Customer, Channel, and Product
Slicing cost data reveals profitability at different levels:
- By customer: Identify which accounts cost more to serve than they generate in margin.
- By channel: Compare e-commerce vs. wholesale vs. retail cost structures—they’re rarely the same.
- By product: Understand how product characteristics (size, fragility, velocity) affect fulfillment cost.
This segmentation turns a single profitability number into actionable intelligence. You move from “we made money this quarter” to “here’s exactly where we made it and where we lost it.”
Cost-to-Serve Analysis vs. Cost-to-Serve Optimization
Here’s a distinction many companies miss: analysis and optimization are not the same thing.
Aspect
Cost-to-Serve Analytisis
Cost-to-Serve Optimization
Purpose
Output
Frequency
Tool
Analysis is diagnostic—it tells you what’s happening. Optimization is prescriptive—it tells you what to do about it. Many companies stop at analysis and never operationalize the insights. That’s leaving money on the table.
How to Build a Cost-to-Serve Model
The goal is to create a repeatable, updatable system—not a one-time analysis that goes stale in a drawer.
1. Collect and Centralize Cost Data
Start by identifying and gathering data from all required sources: ERP, TMS, WMS, and order management systems or often the case data can be sourced from a central data lake. The challenge? This data often lives in separate silos with different formats and update frequencies. Getting it into one place is always challenging.
2. Integrate Data Across Systems
Next, connect transactional data (orders, shipments) with cost data. The old way involved weeks of manual integration using Excel, SQL, and ETL scripts. Modern platforms can automate this process—reducing what used to take 8 weeks to just days.
3. Apply Activity-Based Costing
Map costs to specific activities, then assign those costs to customers, products, or channels based on their consumption. This is where the real insight emerges. You’re not guessing anymore—you’re measuring.
4. Segment and Allocate Costs
Build customer, channel, and product profitability views. Allocation rules matter here—they need to reflect reality, not just convenience. A bad allocation rule will give you confident-looking numbers that are completely wrong.
5. Monitor and Optimize Continuously
A cost-to-serve model isn’t a one-time project. Customer behavior shifts. Costs change. The model needs regular refreshes to remain useful for ongoing decision-making. Quarterly updates are a reasonable starting point.
Turn Cost-to-Serve Into a Strategic Advantage with Sophus
In most organizations, cost-to-serve lives in spreadsheets, disconnected BI dashboards, or one-off consulting studies. By the time insights are ready, the market has already shifted. Teams debate numbers instead of making decisions. Finance, logistics, and supply chain often see different versions of the truth.
Sophus changes that.
Sophus AI provides a unified, plug-and-play platform for supply chain decision intelligence. It connects data, builds a supply chain digital twin, and turns complex models into clear, actionable decisions. Cost-to-serve becomes part of a broader decision engine, not a static report.
End-to-End Cost-to-Serve Modeling
Sophus automatically allocates costs across the full supply chain. From suppliers and plants to distribution centers and last-mile delivery, every cost is mapped to specific products, customers, and channels.
This gives leaders true product-customer level profitability. Hidden losses that never show up on high-level P&L statements become visible. Instead of asking, “Are we profitable overall?” you can ask,
- Which SKU is eroding margin?
- How much profit do we get by selling this product to this customer?
Digital Sandbox for Scenario Testing
Sophus acts as a digital sandbox.
You can test pricing changes, warehouse relocations, transport mode shifts, freight consolidation strategies, or service level changes in one environment. The platform’s interactive what-if scenario planning allows users to simulate impact before committing capital.
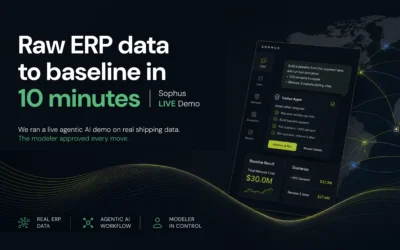
Instead of waiting weeks for a new study, teams can see cost and margin impact in minutes. That shortens decision latency from months to days.
Connecting Cost Visibility to Optimization
Many tools stop at visualization. Spreadsheets and BI dashboards show what happened. They do not tell you what to change.
Sophus integrates cost-to-serve directly with:
- Supply chain network design
- Inventory and replenishment optimization
- Transportation mode and route optimization
- S&OP and supply planning
Cost-to-serve is embedded within a broader decision framework. This means you do not just analyze cost drivers. You optimize them.
When cost models connect directly to decision engines, companies move from insight to action in the same platform.
From Siloed Tools to Unified Decisions
Sophus helps in checking how many legacy or point solutions remain siloed, slow, or costly to maintain. Some require heavy customization. Others charge by solving hours. Many struggle with cross-functional adoption.
Sophus provides:
- 100% cloud-native collaboration
- Unified data model and supply chain digital twin
- Broad scope from strategic design to operational planning
This removes friction between finance, logistics, production, and commercial teams. Everyone works from the same data, the same model, and the same scenarios.
Cost-to-Serve as a Strategic Lever
Cost-to-serve should not be a quarterly exercise. It should be a living model that guides daily and strategic decisions.
With Sophus, companies can:
- Identify unprofitable customers and SKUs
- Redesign networks to reduce structural cost
- Optimize inventory without hurting service
- Align transportation strategy with margin goals
- Prioritize demand that maximizes profit
In simple terms, Sophus allows organizations to visualize, analyze, and optimize their entire supply chain cost structure in one place.
The result is not just better reporting. It is a better decision.
Real-World Impact: How Sophus Redefined Cost-to-Serve at Scale
Sophus helps global enterprises move beyond cost reporting to cost optimization. By embedding cost-to-serve intelligence into network design, inventory strategy, and planning processes, companies gain clear visibility into true profitability drivers. The result is measurable savings, faster decisions, and structurally stronger margins across complex supply chains.
Hisense – Engineering Margin Through Global Network Optimization
Hisense deployed Sophus X within its private cloud to build a secure, end-to-end digital twin of its global supply chain. By modeling production allocation, cross-border logistics, and regional distribution flows at a granular level, the company uncovered hidden cost-to-serve inefficiencies across markets. Optimization-led rebalancing of factory-to-market flows reduced global logistics costs by 5%, while strengthening SKU-level profitability visibility and improving strategic network decisions worldwide.
Lee Kum Kee – Unlocking Structural Savings Through Network Redesign
Facing rising export and distribution complexity, Lee Kum Kee used Sophus to redesign its global supply chain with cost-to-serve as the central metric. By analyzing facility footprint, freight lanes, and inventory placement in one unified model, the company identified structural cost drivers embedded in its network. The result was over $20 million in sustainable savings and a more resilient, margin-focused distribution strategy.
From Cost Visibility to Competitive Advantage
Cost-to-serve solutions are not just about reducing expenses. They help you price smarter, serve the right customers, and grow with confidence.
Companies that embed cost intelligence into daily decisions consistently outperform those relying on spreadsheets and one-time studies. The real advantage comes down to speed and action. When you see true profitability in real time and test scenarios instantly, you move ahead while others are still debating numbers.
The future belongs to organizations that treat optimization as a continuous discipline. Resilience is not about building buffers everywhere. It is about making precise, data-driven decisions across your network.
Ready to turn cost insight into measurable profit?
See how fast you can move from analysis to action.